CandelaCharts
CandelaCharts.comPricing
  • Get started
    • Quick Start
    • What is CandelaCharts?
    • FAQs
    • Community
  • Toolkits
    • Price Action Toolkit™
      • Overview
      • Market Structure
      • Block Concepts
      • Imbalance Concepts
      • Premium & Discount
      • Liquidity Concepts
      • Fib Retracement
      • Highs & Lows MTF
      • Scanners
      • Alerts
      • FAQs
    • Imbalance Concepts™
      • Overview
      • Fair Value Gaps
      • Inversion Fair Value Gaps
      • Opening Gaps
      • Balanced Price Range
      • Volume Imbalance
      • New Day Opening Gap
      • New Week Opening Gap
      • Alerts
    • Block Concepts™
      • Overview
      • Order Blocks
      • Swing Order Blocks
      • Breaker Blocks
      • Metrics
      • Alerts
    • Weekly Profiles™
      • Overview
      • ICT Weekly Profiles
      • ICT Missing Weekly Profiles
      • Scanner
    • Daily Profiles™
      • Overview
      • ICT Daily Profiles
      • Scanner
  • Models
    • Fractal Range Model™
      • Overview
      • Timeframe Pairing
      • Components
      • C-area
      • Labels
      • Statuses
      • Framework
      • Filters
      • PD Arrays
      • Projections
      • SMT
      • Dashboard
      • Alerts
    • Unicorn Model™ 🔜
    • CRT Model™
      • Overview
      • Timeframe Alignment
      • Components
      • Labels
      • Statuses
      • Framework
      • Time
      • Projections
      • Dashboard
      • Alerts
    • X Model™
      • Overview
      • Timeframe Agreement
      • Components
      • Labels
      • Statuses
      • Framework
      • Dashboard
      • Alerts
  • Statistics
    • OHLC Range Map™
      • Overview
      • Timeframes
      • PO3
      • Calculation
      • Liquidity
      • Statistics
      • Panel
      • Alerts
    • OHLC Session Range Map™
      • Overview
      • Sessions
      • PO3
      • Calculation
      • Liquidity
      • Statistics
      • Panel
      • Alerts
    • OHLC Macro Range Map™
      • Overview
      • Macros
      • PO3
      • Calculation
      • Liquidity
      • Statistics
      • Panel
      • Alerts
    • OHLC Volatility Range Map™
      • Overview
      • Themes
      • Visualization
      • Calculation
      • Statistics
  • Changelogs
    • Toolkits
      • Smart Money Concepts
      • Imbalance Concepts
      • Block Concepts
      • Weekly Profiles
      • Daily Profiles
    • Models
      • Fractal Range Model
      • CRT Model
      • X Model
    • Statistics
      • OHLC Range Map
      • OHLC Session Range Map
      • OHLC Macro Range Map
      • OHLC Volatility Range Map
Powered by GitBook
On this page
Export as PDF
  1. Toolkits
  2. Daily Profiles™

ICT Daily Profiles

ICT Daily Profiles

PreviousOverviewNextScanner

Last updated 11 days ago

ICT Daily Profiles provide a systematic framework for analyzing market behavior across various intraday sessions, enabling traders to align their strategies with recurring patterns and tendencies observed within a single trading day.

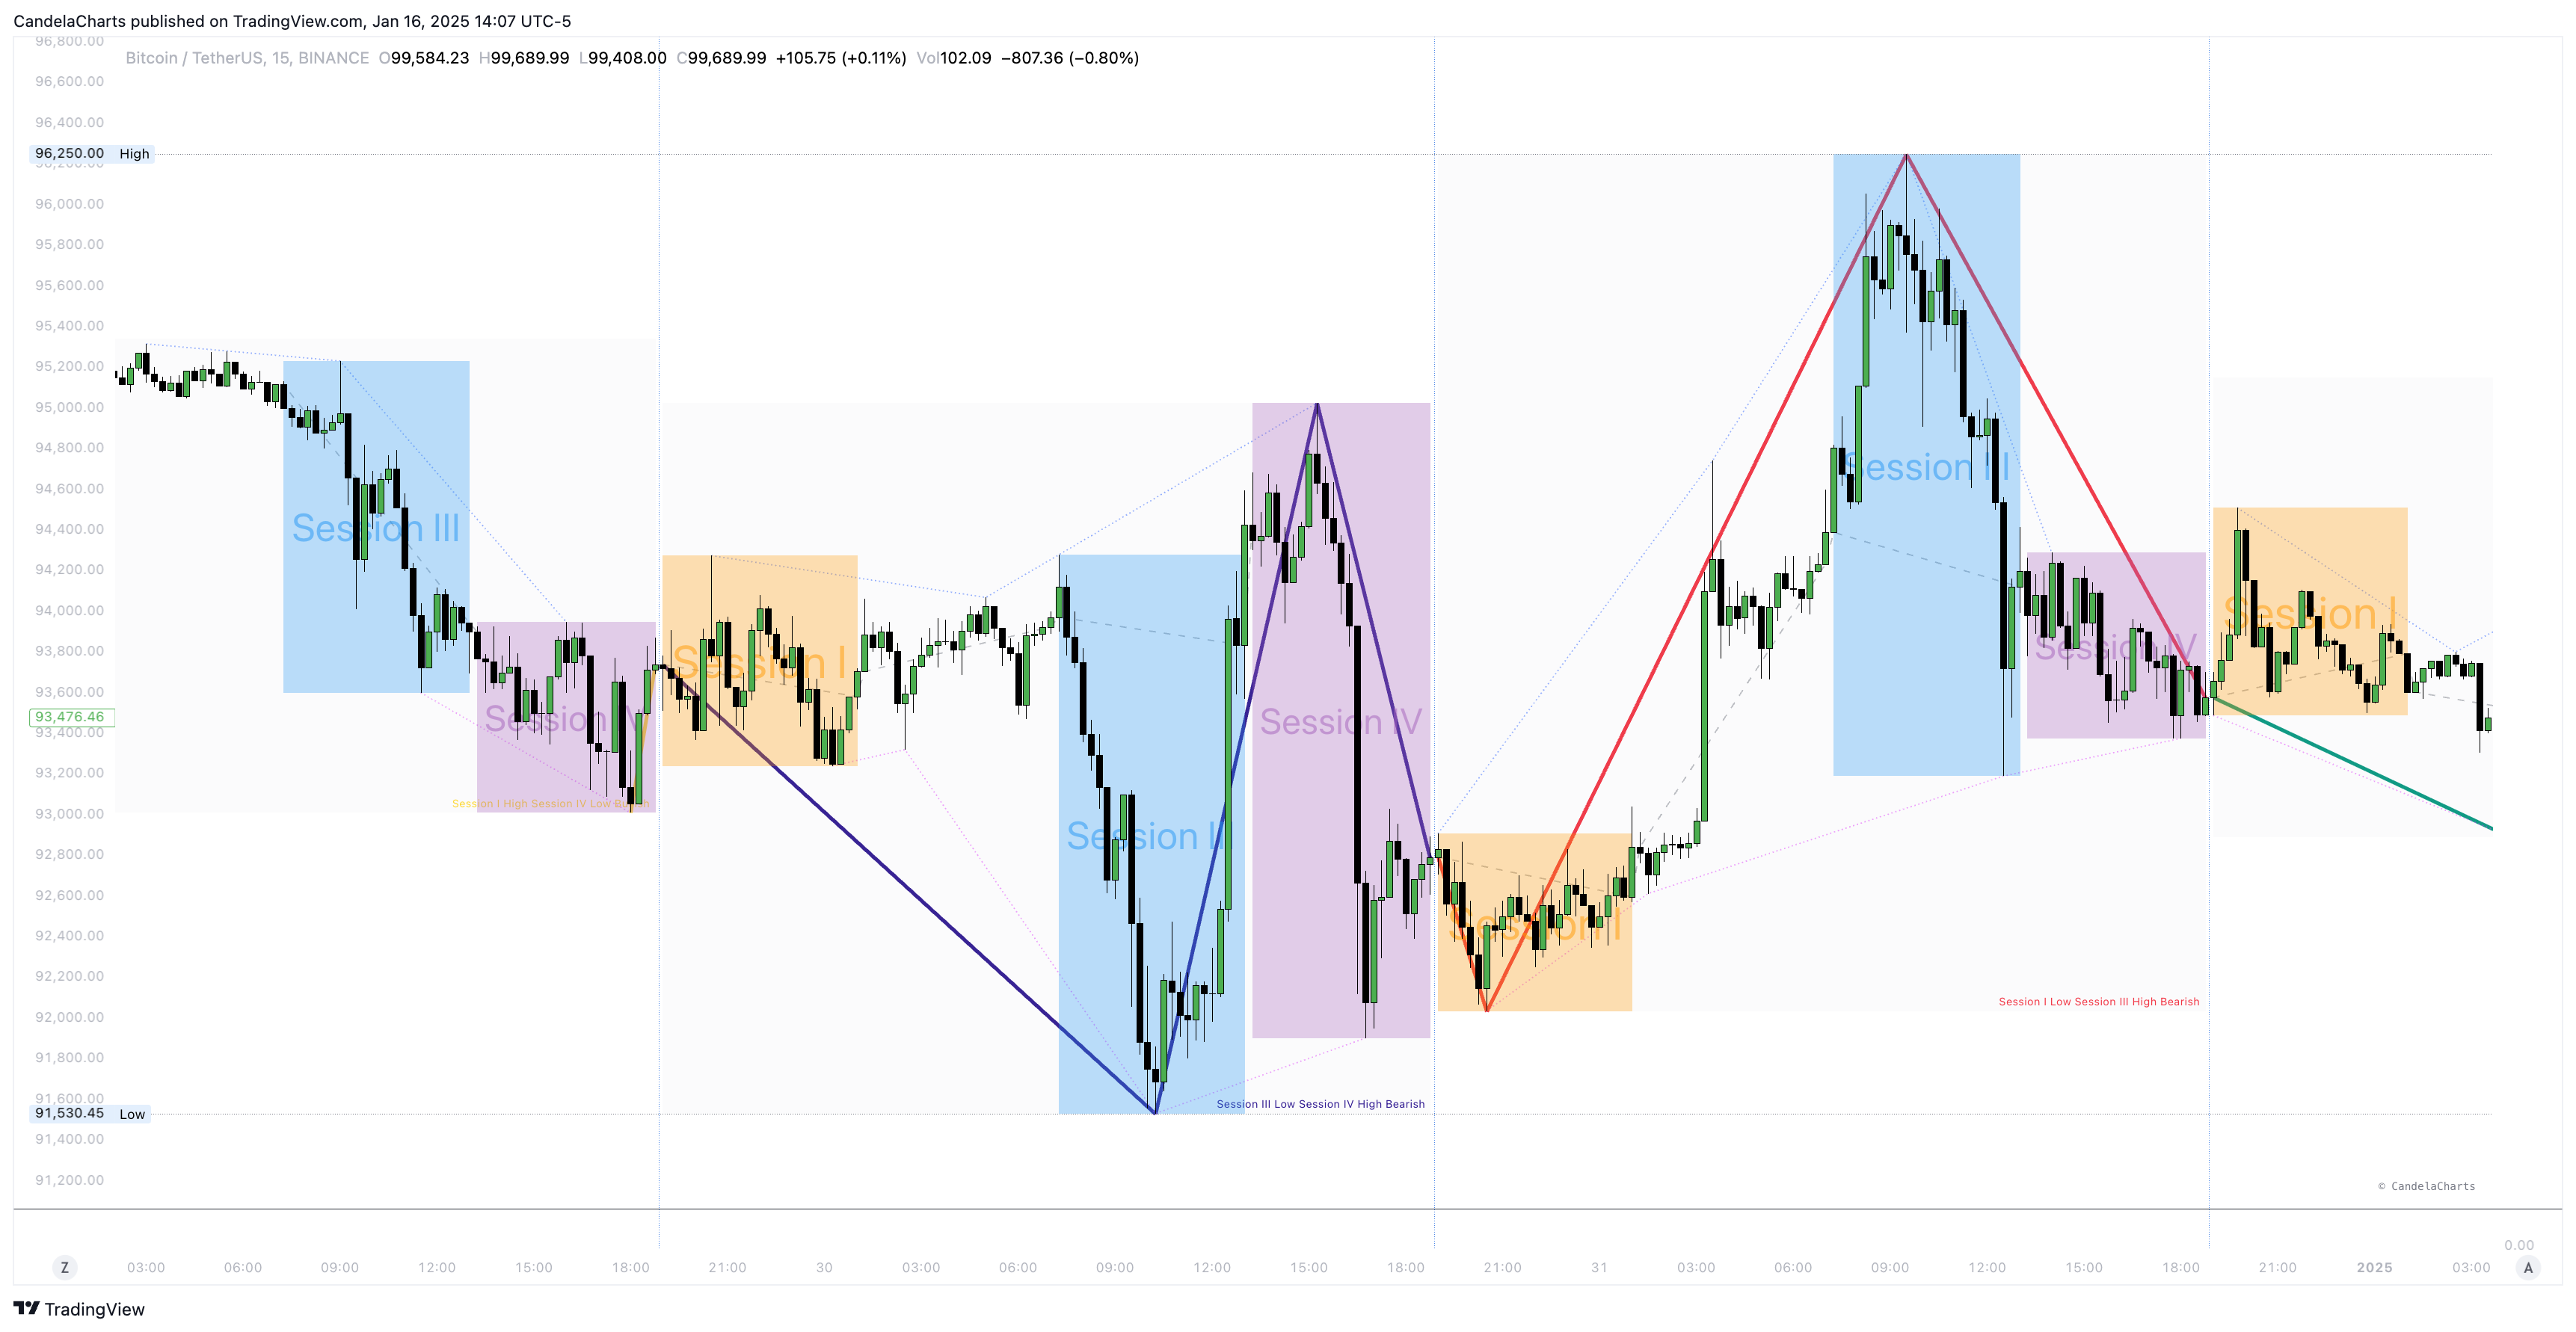
The ICT Daily Profiles toolkit encompasses all possible high/low combinations that can occur within a single day, offering a more comprehensive approach compared to ICT's primary focus on the London and NY sessions.

ICT Daily Profiles

  • Session I High Session II Low Bearish

  • Session I High Session III Low Bearish

  • Session I High Session IV Low Bearish

  • Session II High Session III Low Bearish

  • Session II High Session IV Low Bearish

  • Session III High Session IV Low Bearish

  • Session I Low Session II High Bullish

  • Session I Low Session III High Bullish

  • Session I Low Session IV High Bullish

  • Session II Low Session III High Bullish

  • Session II Low Session IV High Bullish

  • Session III Low Session IV High Bullish

  • Session I High Session I Low Bearish (same session H/L)

  • Session I Low Session I High Bearish (same session H/L)

  • Session II High Session II Low Bearish (same session H/L)

  • Session II Low Session II High Bearish (same session H/L)

  • Session III High Session III Low Bearish (same session H/L)

  • Session III Low Session III High Bearish (same session H/L)

  • Session IV High Session IV Low Bearish (same session H/L)

  • Session IV Low Session IV High Bearish (same session H/L)

ICT Daily Profiles -

https://pbs.twimg.com/media/Ghb-WM8WwAAyjQF?format=jpg&name=4096x4096