> For the complete documentation index, see [llms.txt](https://docs.candelacharts.com/llms.txt). Markdown versions of documentation pages are available by appending `.md` to page URLs; this page is available as [Markdown](https://docs.candelacharts.com/investing/macro-and-liquidity/macro-sentiment-index/features.md).
# Features
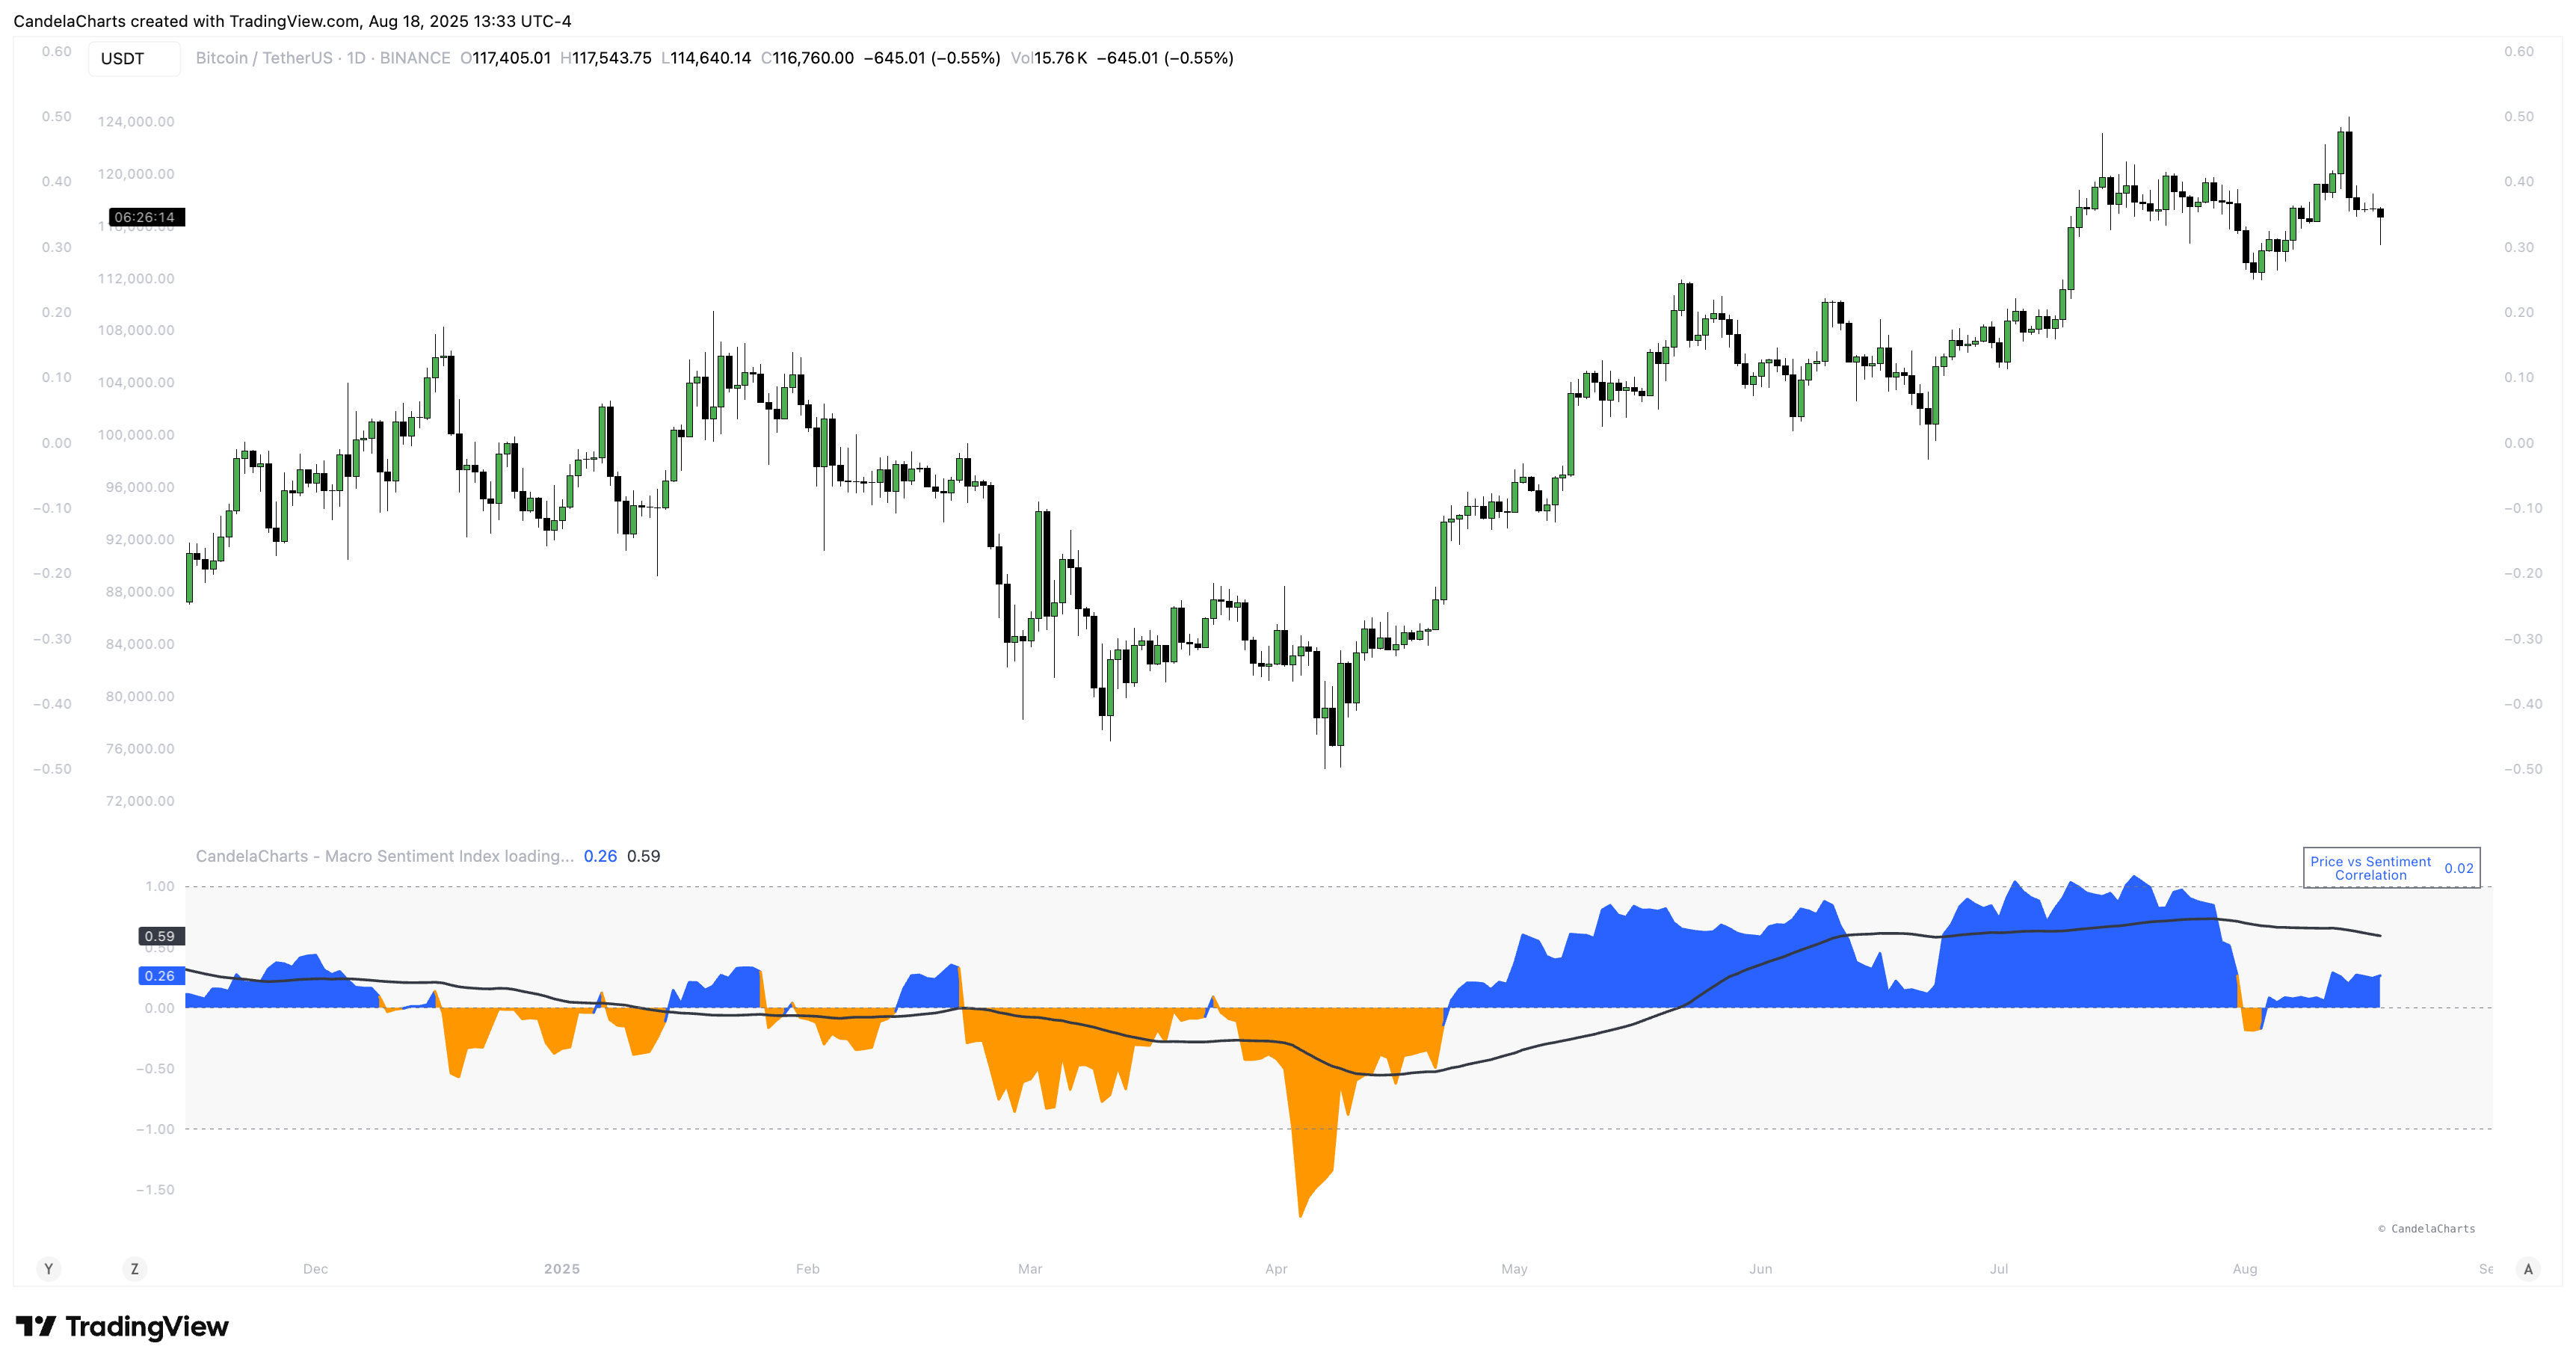
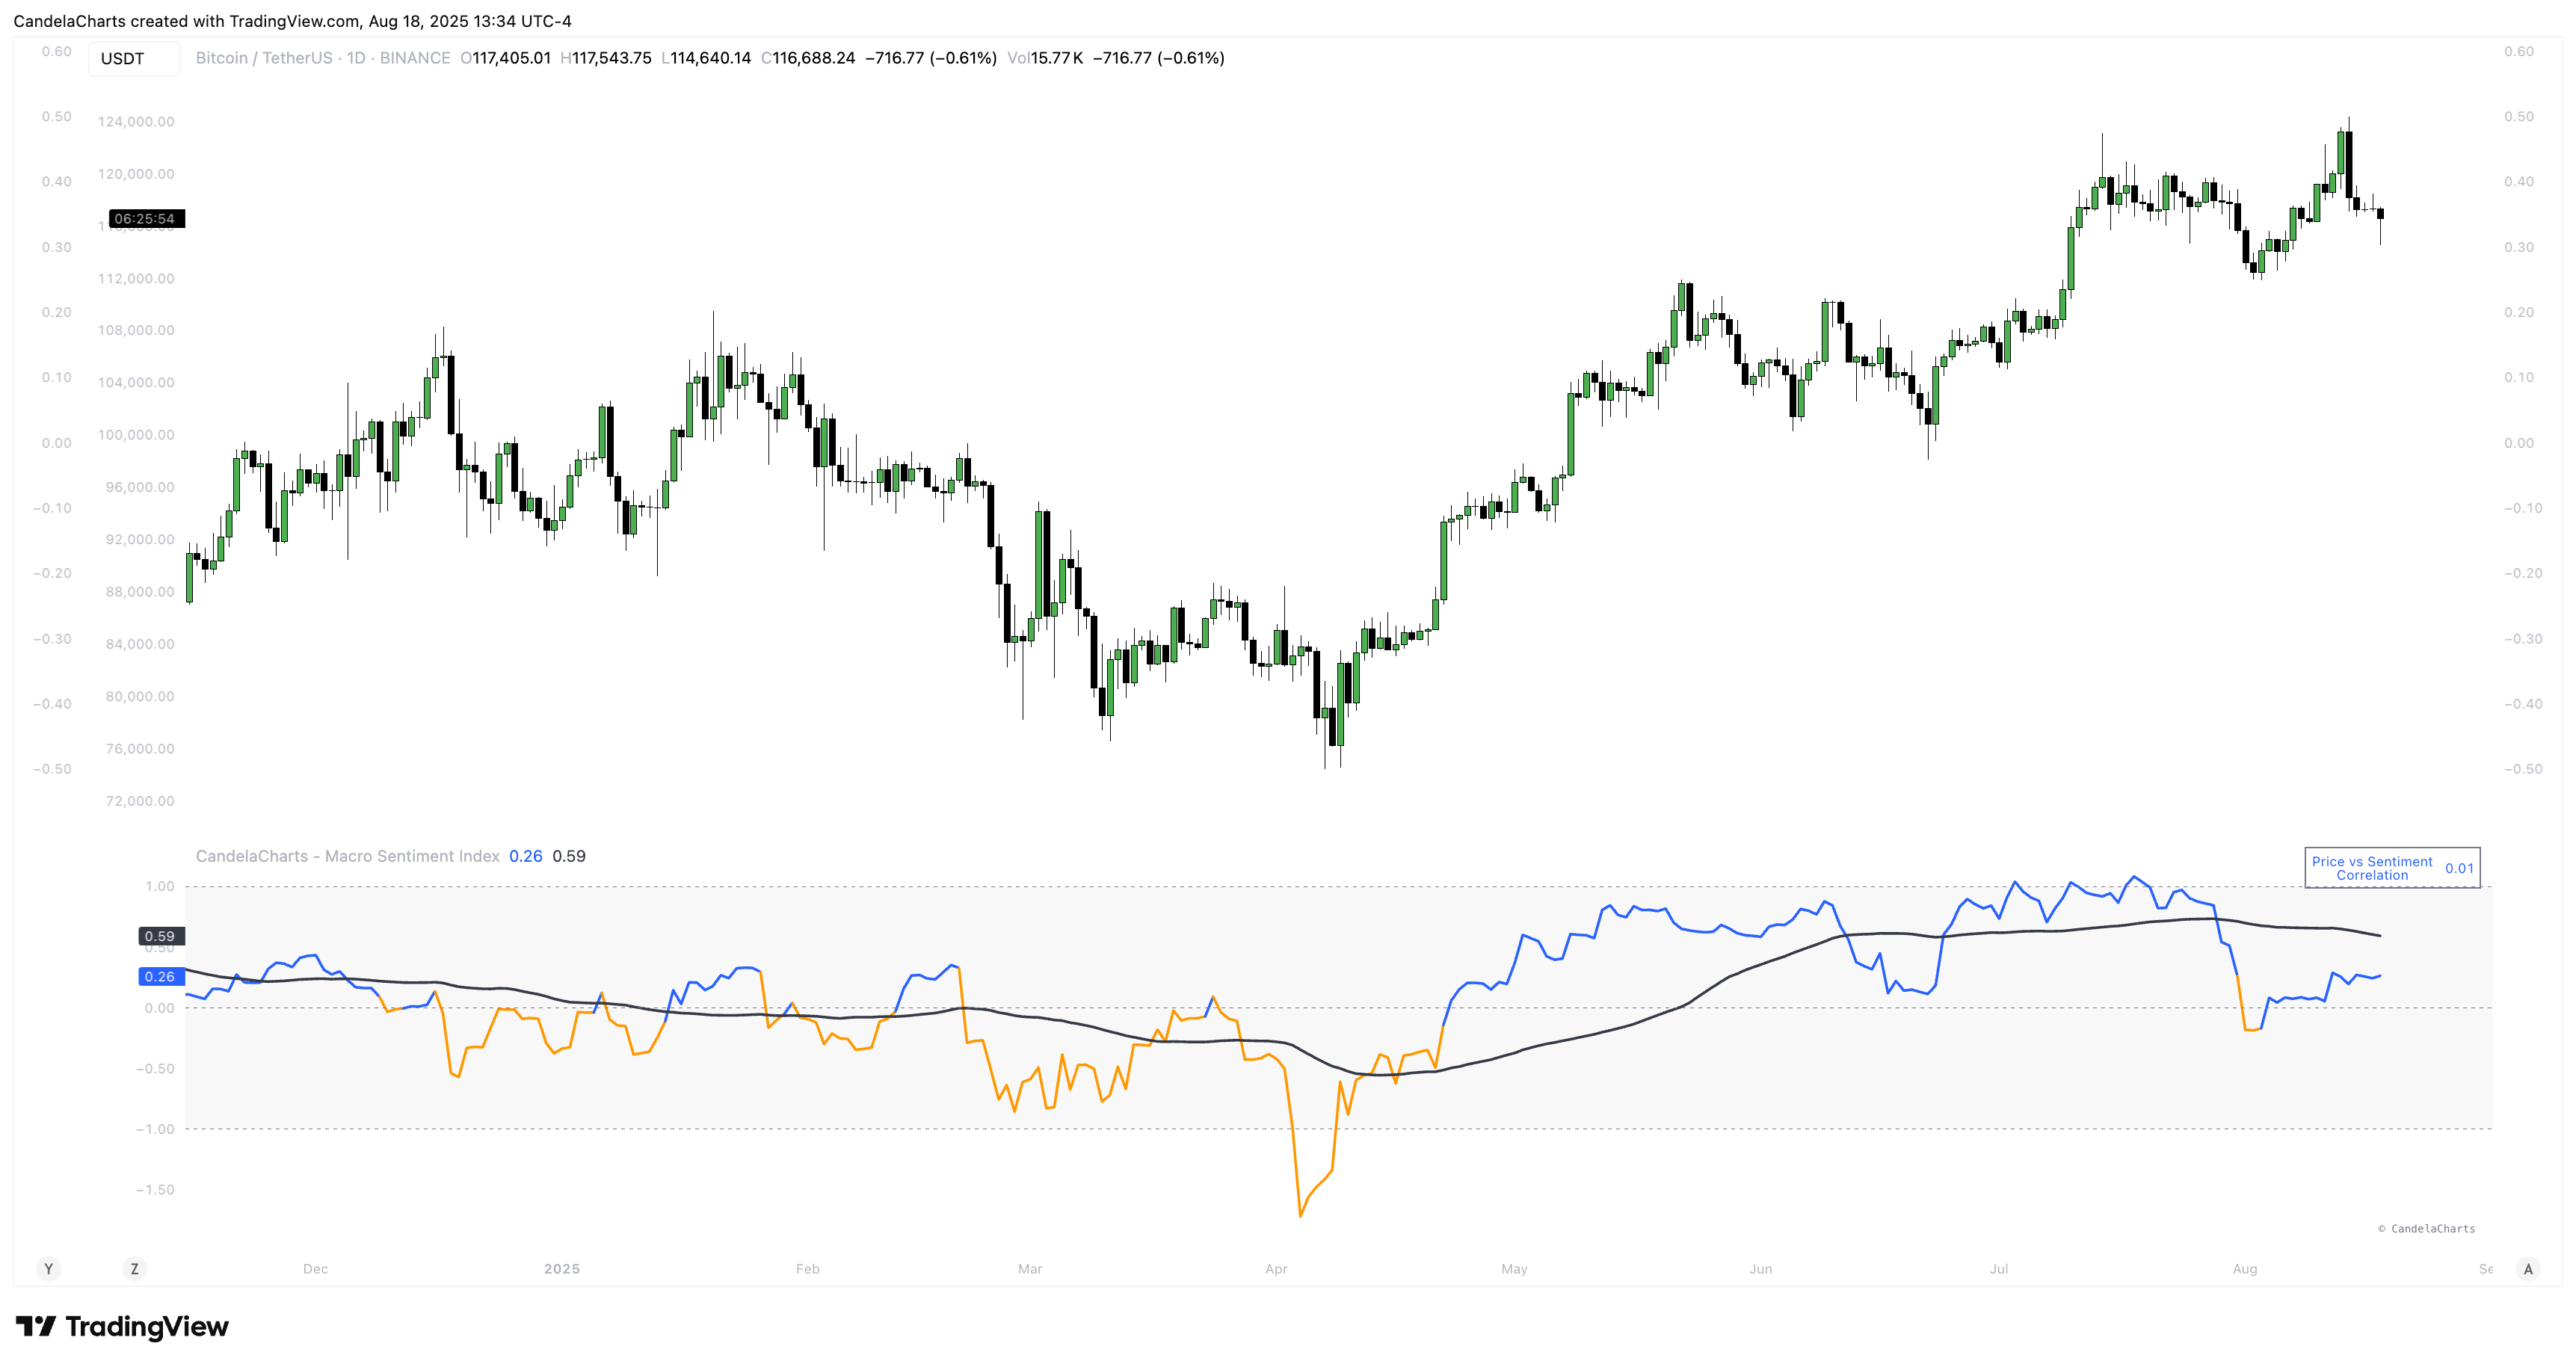
Macro Sentiment Index Features
### **1. Multi-Dimensional Inputs**
MSI integrates diverse asset classes and indicators:
* **Equity Benchmarks**: SPY, QQQ, IWM, EEM
* **Fixed Income**: TLT, HYG, LQD, SHY
* **Commodities**: Gold (GC), Copper (HG), Oil (CL), BCOM
* **Volatility**: VIX, VVIX, MOVE, SKEW
* **FX Pairs**: USD/JPY, USD/CHF, AUD/JPY, DXY
* **Yield Curves**: 10Y-2Y Spread (TYX), 10Y-5Y (TNX-FEDFUNDS)
* **Monetary Policy**: SOFR, ED, FF futures
* **Global Macro**: BDIY, M2, TED Spread, Put/Call Ratio
* **Sector Rotation**: XLU/XLY, XLY/XLP
* **Sentiment Ratios**: SPY/TLT, HYG/LQD, BTC/Gold, Copper/Gold
### **2. Adaptive Scoring System**
Each input is transformed into a **z-score** over a configurable lookback window (default: 60 days), capturing relative strength/weakness in real-time. Directionality is adjusted so that all components contribute consistently to the final score:
* Rising equities, credit, commodities → **positive contribution**
* Rising volatility, safe-haven assets, yield curve inversion → **negative contribution**
### **3. Weighted Aggregation**
Users can customize the influence of each component via adjustable weights (default: 0.1–3.0). This allows tuning for specific regimes or beliefs about market structure.
The final index is a **weighted average** of all active component scores.
### **4. Smoothing & Visualization Modes**
* Optional **moving average** (SMA, EMA, RMA, VWMA) with user-defined length and type
* Multiple display styles: **Columns**, **Histogram**, **Area**, or **Line**
* Neutral threshold at 0, with upper (+1) and lower (−1) zones marking extremes
### **5. Correlation Monitoring**
A dynamic **price vs. sentiment correlation table** appears on-chart, calculating the rolling correlation (default: 20 periods) between asset price changes and the MSI. This helps identify divergence and regime shifts.
### **6. Customizable UI**
* Adjustable text size and font (Monospace or Default)
* Optional branding toggle
* Configurable color scheme for bull/bear phases and MA line
---
# Agent Instructions
This documentation is published with GitBook. GitBook is the documentation platform designed so that both humans and AI agents can read, navigate, and reason over technical content effectively. Learn more at gitbook.com.
## Querying This Documentation
If you need additional information that is not directly available in this page, you can query the documentation dynamically by asking a question.
Perform an HTTP GET request on the current page URL with the `ask` query parameter, and the optional `goal` query parameter:
```
GET https://docs.candelacharts.com/investing/macro-and-liquidity/macro-sentiment-index/features.md?ask=&goal=
```
`ask` is the immediate question: it should be specific, self-contained, and written in natural language.
`goal` is optional and describes the broader end goal you are ultimately trying to accomplish on behalf of the user. GitBook uses it to tailor the answer towards what is most useful for that goal.
The response will contain a direct answer to the question and relevant excerpts and sources from the documentation.
Use this mechanism when the answer is not explicitly present in the current page, you need clarification or additional context, or you want to retrieve related documentation sections.