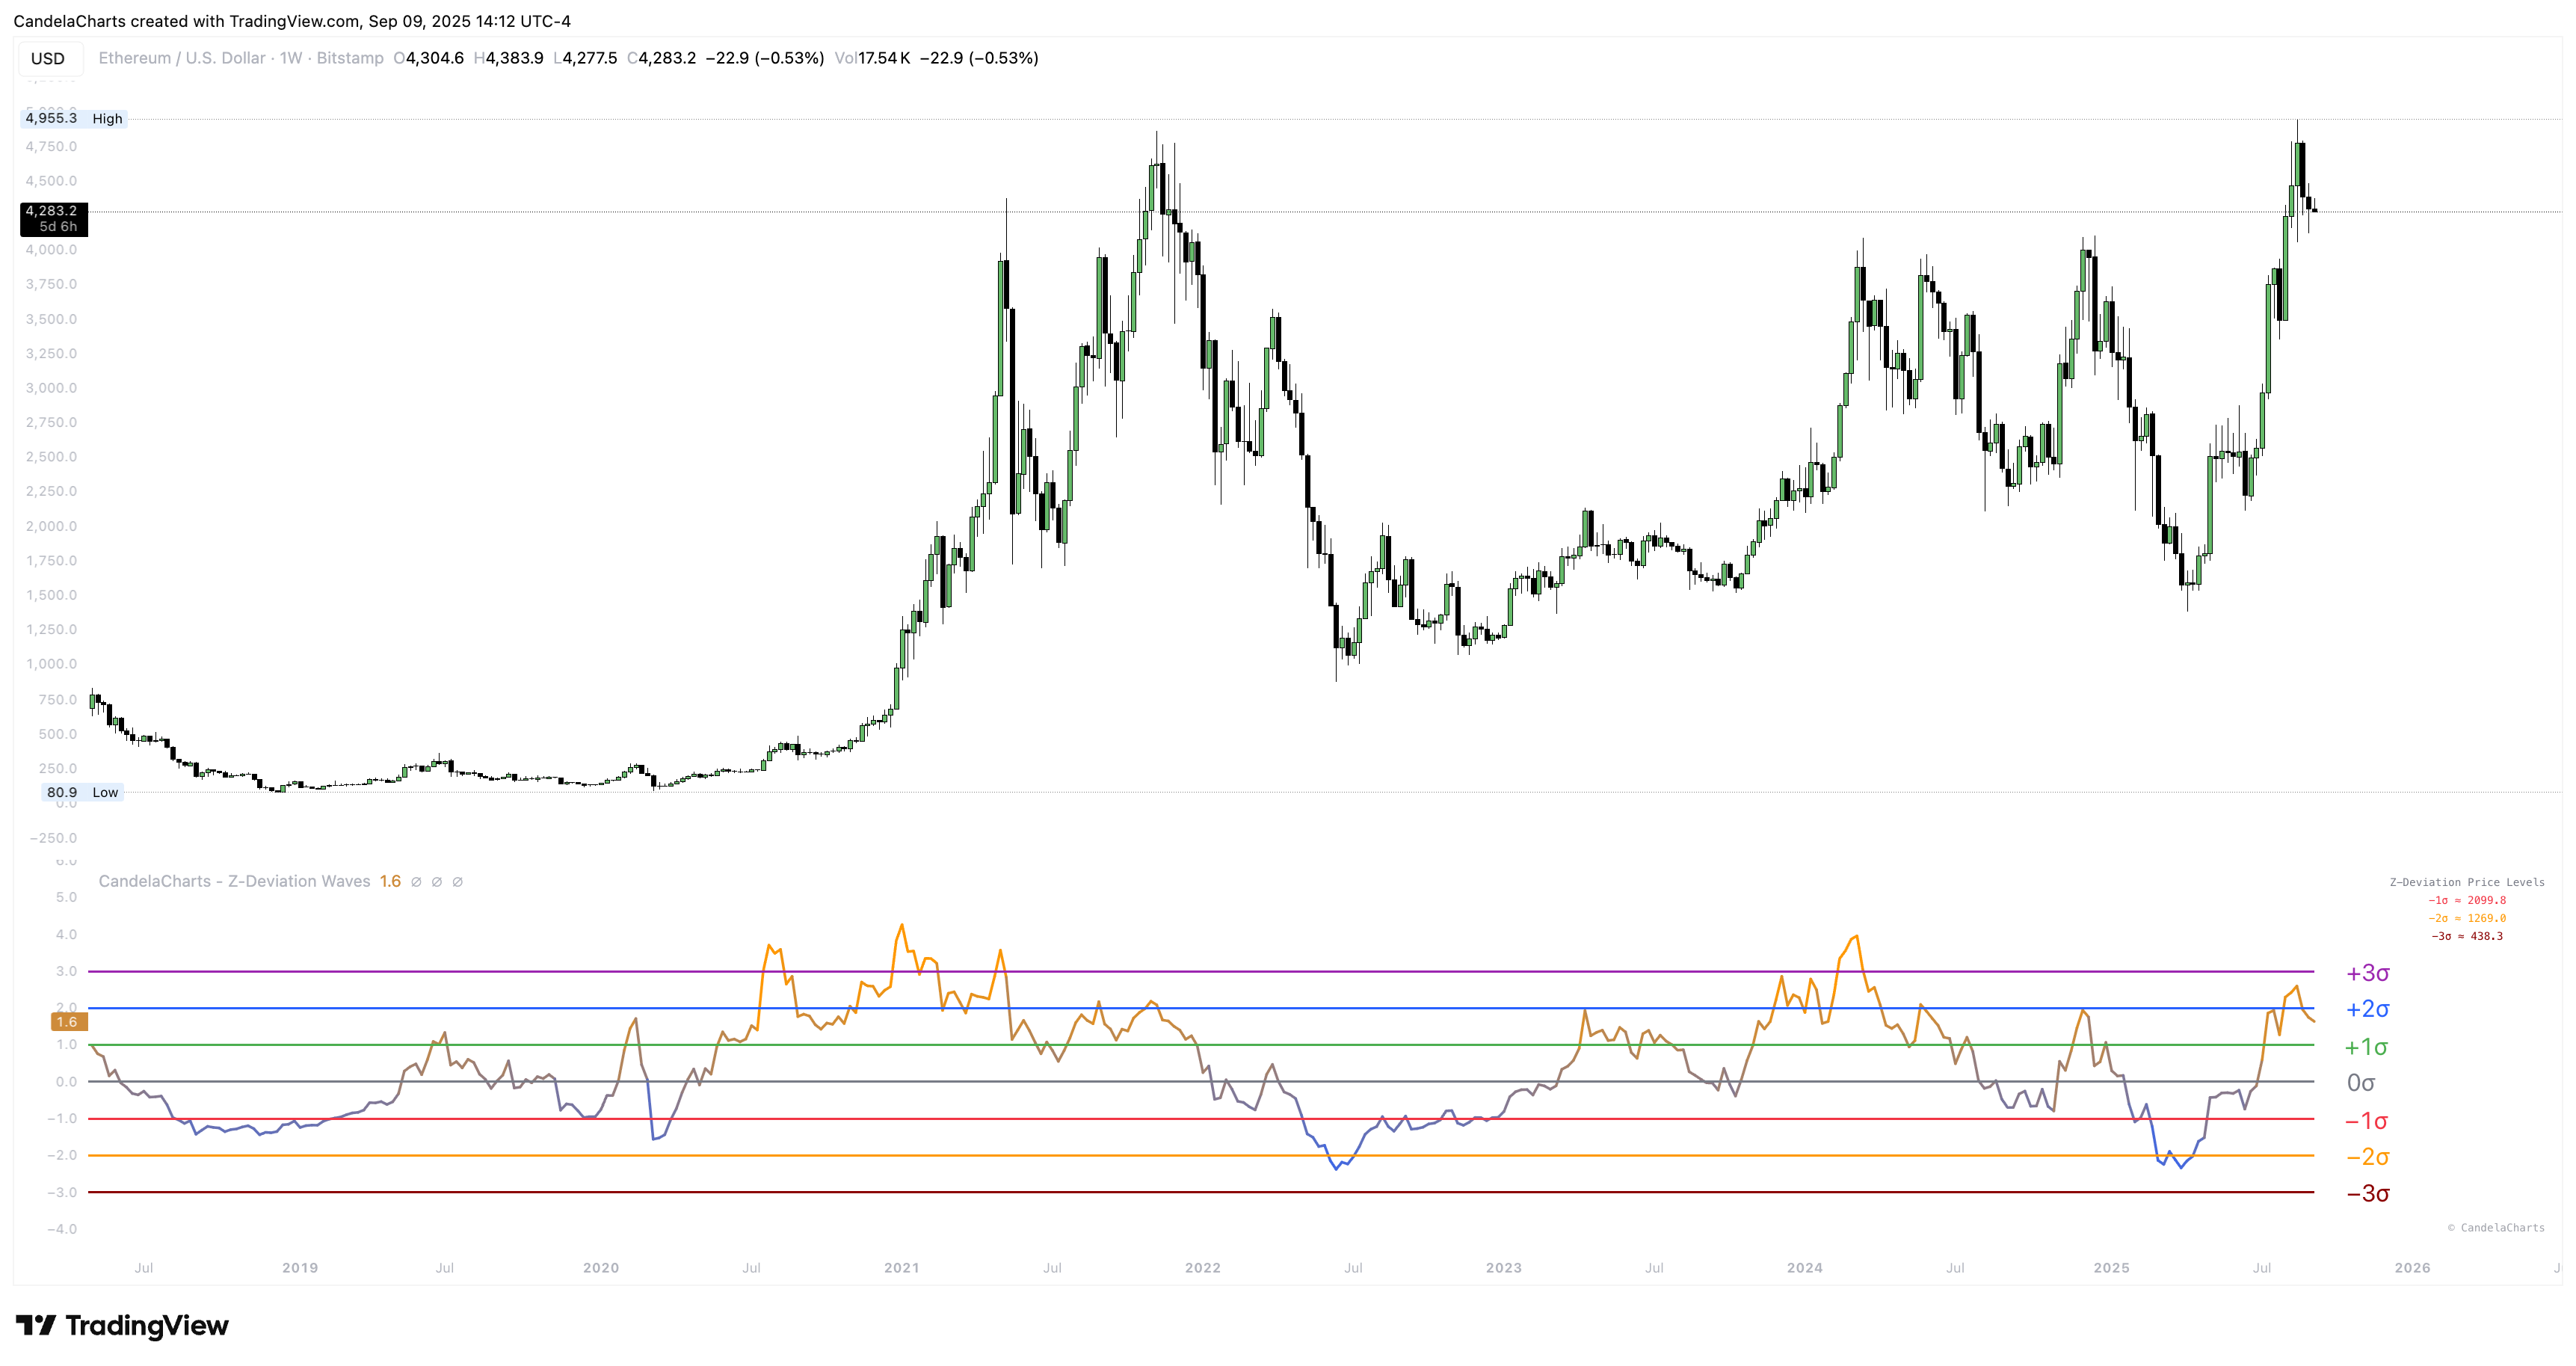
> For the complete documentation index, see [llms.txt](https://docs.candelacharts.com/llms.txt). Markdown versions of documentation pages are available by appending `.md` to page URLs; this page is available as [Markdown](https://docs.candelacharts.com/investing/momentum-and-oscillators/z-deviation-waves/usage.md).
# Usage
Z-Deviation Waves Usage
When σ becomes a habit, entries/exits feel less like hunches and more like process.
**Quick start**
1. Set **Period = 50**, **Label Mode = Z-score (σ)**, **Smoothing = 1**.
2. Watch how price behaves at **±1σ / ±2σ / ±3σ** for a few cycles.
3. Switch to **Price @ σ** once you’re ready to turn context into orders/alerts.
4. If the wave chatters, try **Smoothing = 3–5**.
**What the tiers usually imply** *(not probabilities; just practical heuristics)*
* **±1σ:** everyday noise; don’t overreact.
* **±2σ:** meaningful stretch; prepare for exhaustion *or* power trend continuation.
* **±3σ:** rare extreme; either blow-off risk or a high-energy reversal area—manage size.
**Two playbooks**
* **Mean-reversion**
* Wait for a tag of **+2σ/+3σ** (or **−2σ/−3σ**).
* Look for **trend columns** to stall or flip, then use structure (candle trigger/HTF level).
* Target the **0σ** or **±1σ** area; trail to stay sensible if it keeps running.
* **Trend continuation**
* In strong uptrends, pullbacks that **hold 0σ/−1σ** often become add-points.
* In downtrends, rallies stalling at **0σ/+1σ** are risk-defined short zones.
* Smoothing = **2–3** can reduce false flips without much lag.
**Copy-and-paste presets**
* **Baseline σ framing:** Z-score (σ), Period 50, Smoothing 1, Trend Columns ON, Downside Table ON.
* **Tradable levels:** Price @ σ, Period 50, Smoothing 3, Downside Table ON (set alerts at −1σ/−2σ/−3σ).
* **Presentation grid:** Price @ Z, Period 50, Smoothing 3 (uniform spacing across tickers).
* **Fast vs. slow window:** Panel A Period 20; Panel B Period 100 on the same symbol.
* **Smoothing contrast:** Smoothing 1 vs. 5 on the same chart.
* **Timeframe contrast:** Same preset on 5-minute and Daily; consider a longer Period for intraday.
**Tuning tips**
* **Period:** shorter (20–30) = faster & noisier; longer (80–100) = steadier & rarer extremes.
* **Source:** `close` is crisp; `hl2`/`hlc3` can tame erratic feeds.
* **Smoothing:** keep it modest (2–5) to reduce chatter without blinding turns.
---
# Agent Instructions
This documentation is published with GitBook. GitBook is the documentation platform designed so that both humans and AI agents can read, navigate, and reason over technical content effectively. Learn more at gitbook.com.
## Querying This Documentation
If you need additional information that is not directly available in this page, you can query the documentation dynamically by asking a question.
Perform an HTTP GET request on the current page URL with the `ask` query parameter, and the optional `goal` query parameter:
```
GET https://docs.candelacharts.com/investing/momentum-and-oscillators/z-deviation-waves/usage.md?ask=&goal=
```
`ask` is the immediate question: it should be specific, self-contained, and written in natural language.
`goal` is optional and describes the broader end goal you are ultimately trying to accomplish on behalf of the user. GitBook uses it to tailor the answer towards what is most useful for that goal.
The response will contain a direct answer to the question and relevant excerpts and sources from the documentation.
Use this mechanism when the answer is not explicitly present in the current page, you need clarification or additional context, or you want to retrieve related documentation sections.