> For the complete documentation index, see [llms.txt](https://docs.candelacharts.com/llms.txt). Markdown versions of documentation pages are available by appending `.md` to page URLs; this page is available as [Markdown](https://docs.candelacharts.com/investing/risk-and-portfolio-management/contango-slope-index/overview.md).
# Overview
Contango Slope Index Quick Specs
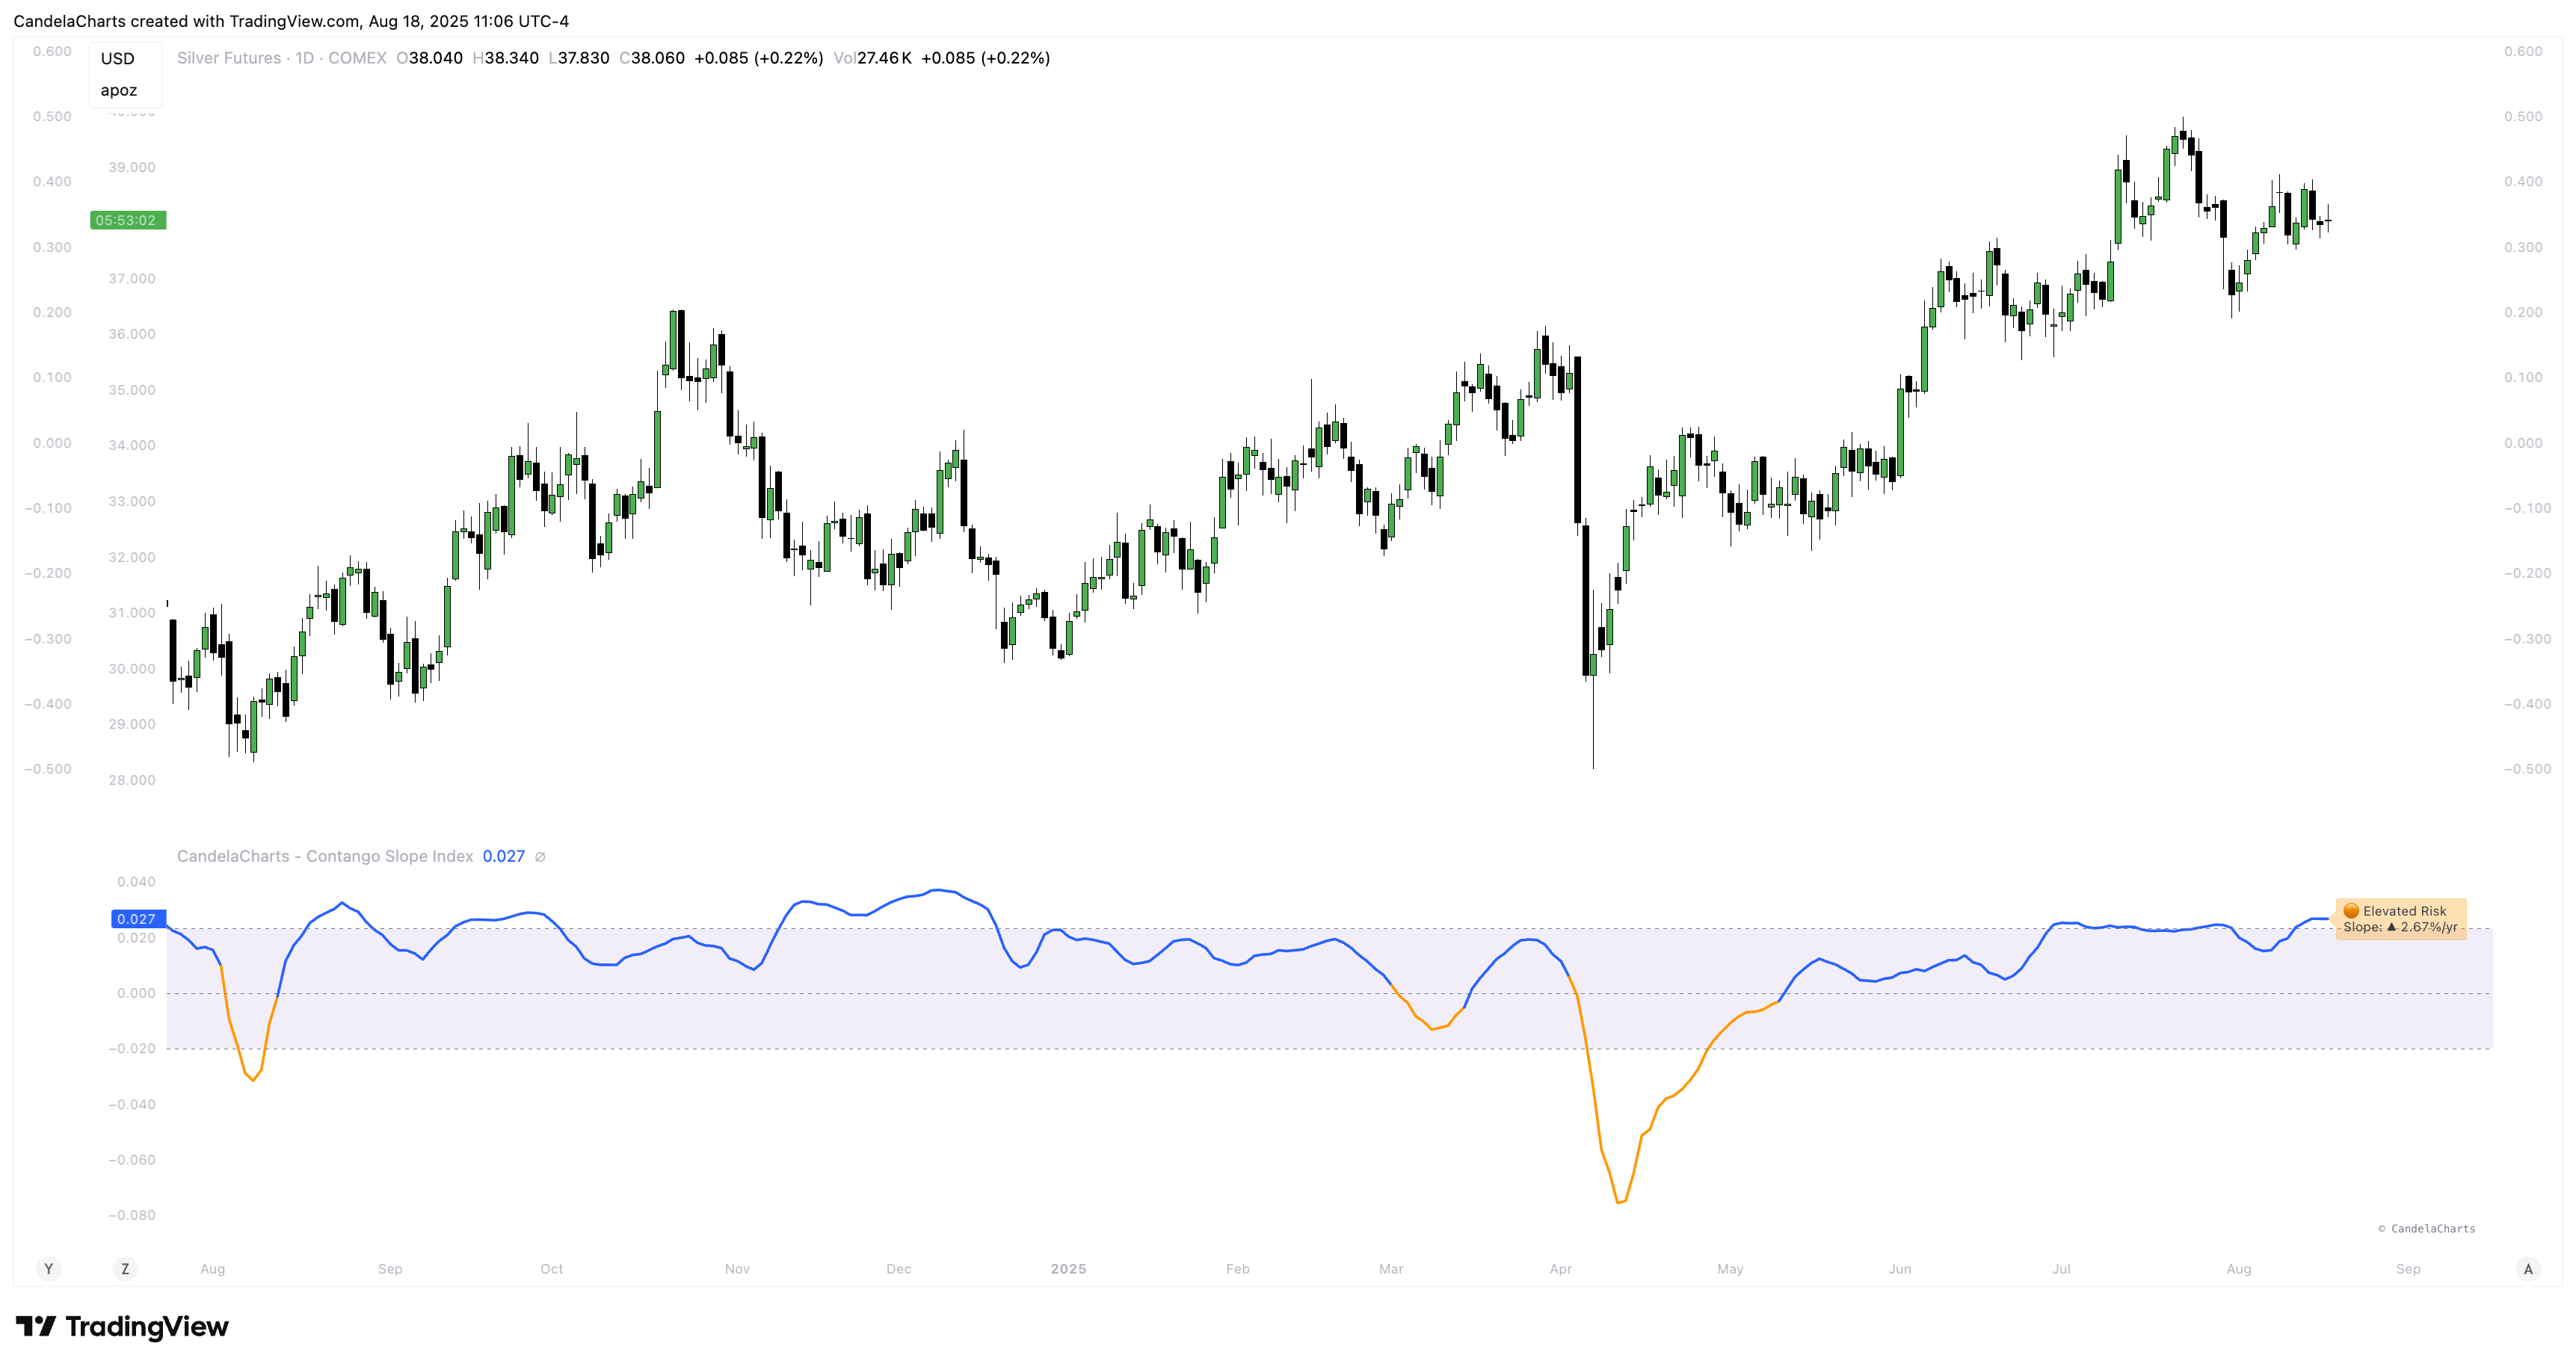
The **Contango Slope Index (CSI)** is a volatility term structure analysis tool designed to quantify the slope of the VIX futures curve over time.
By measuring the rate of change in implied volatility across multiple tenors—such as VIX1D, VIX (1M), VIX3M, VIX6M, and VIX1Y—the CSI provides traders and analysts with real-time insights into market sentiment, risk appetite, and potential turning points in equity markets.
Developed by CandelaCharts, the CSI draws from established financial research on volatility term structures, particularly focusing on how **contango** (upward-sloping curve) and **backwardation** (downward-sloping curve) regimes correlate with future market behavior.
The index computes a normalized slope using linear regression across available VIX futures, offering a dynamic view of evolving market expectations.
The core output—a slope value expressed in annualized percentage points per year (%/yr)—represents the steepness of the volatility curve:
* **Positive slope**: Contango regime, typically associated with market stability and complacency.
* **Negative slope**: Backwardation, historically linked to fear, near-term uncertainty, and often preceding market rallies.
* **Slope crossing zero or key thresholds**: Generates regime shifts and alert conditions.
{% content-ref url="/pages/0Y2ctsjNLo2E8KTiXAJf" %}
[Features](/investing/risk-and-portfolio-management/contango-slope-index/features.md)
{% endcontent-ref %}
{% content-ref url="/pages/0a4eB9QBEe0EKcCLueEb" %}
[Usage](/investing/risk-and-portfolio-management/contango-slope-index/usage.md)
{% endcontent-ref %}
{% content-ref url="/pages/2uzLlFsyCi32WWlQNV0P" %}
[Confluences](/investing/risk-and-portfolio-management/contango-slope-index/confluences.md)
{% endcontent-ref %}
{% content-ref url="/pages/FgBfFHgcuduFrBcgeYhm" %}
[FAQs](/investing/risk-and-portfolio-management/contango-slope-index/faqs.md)
{% endcontent-ref %}
The CSI also includes moving average smoothing, regime classification, and background coloring to enhance interpretability and integration into tactical decision-making frameworks.
---
# Agent Instructions
This documentation is published with GitBook. GitBook is the documentation platform designed so that both humans and AI agents can read, navigate, and reason over technical content effectively. Learn more at gitbook.com.
## Querying This Documentation
If you need additional information that is not directly available in this page, you can query the documentation dynamically by asking a question.
Perform an HTTP GET request on the current page URL with the `ask` query parameter, and the optional `goal` query parameter:
```
GET https://docs.candelacharts.com/investing/risk-and-portfolio-management/contango-slope-index/overview.md?ask=&goal=
```
`ask` is the immediate question: it should be specific, self-contained, and written in natural language.
`goal` is optional and describes the broader end goal you are ultimately trying to accomplish on behalf of the user. GitBook uses it to tailor the answer towards what is most useful for that goal.
The response will contain a direct answer to the question and relevant excerpts and sources from the documentation.
Use this mechanism when the answer is not explicitly present in the current page, you need clarification or additional context, or you want to retrieve related documentation sections.