> For the complete documentation index, see [llms.txt](https://docs.candelacharts.com/llms.txt). Markdown versions of documentation pages are available by appending `.md` to page URLs; this page is available as [Markdown](https://docs.candelacharts.com/models/amd-model/framework.md).
# Framework
AMD Model Framework
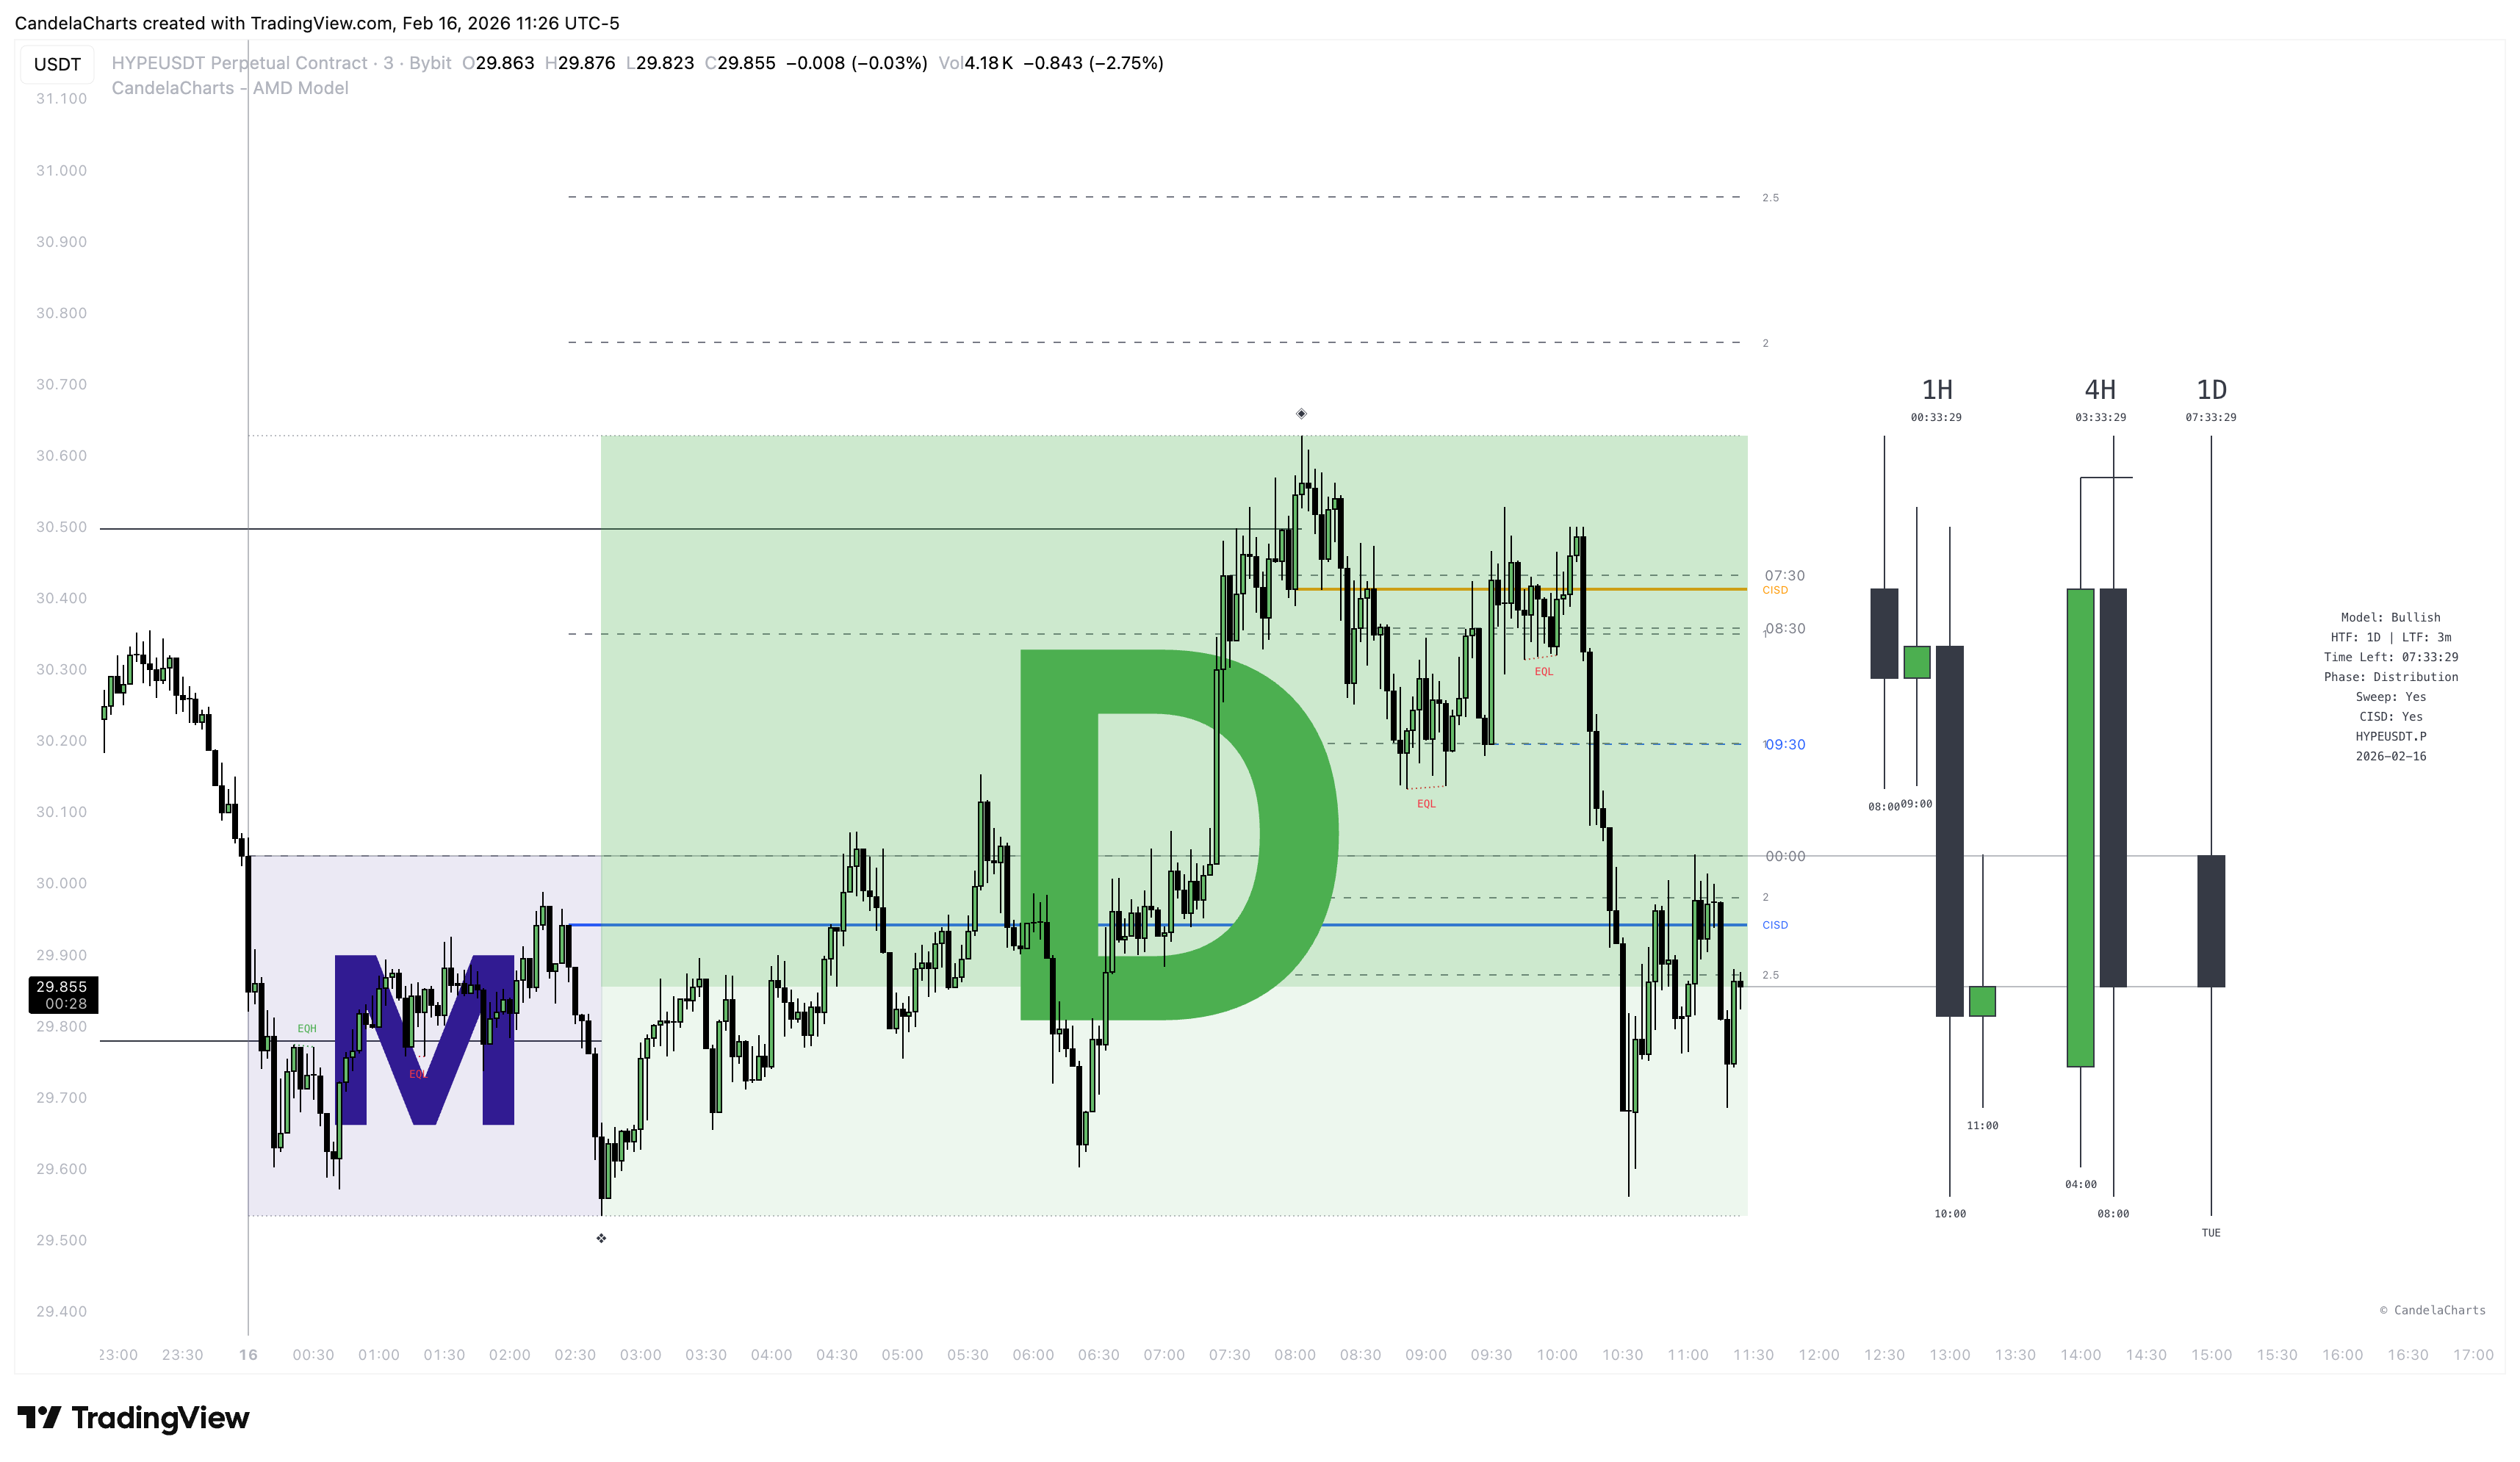
The AMD Model is built on a simple yet profound understanding of how institutions move price. It posits that every major move consists of three distinct phases: **Accumulation**, **Manipulation**, and **Distribution**.
Here is how the framework breaks down:
### 1. Accumulation (The Setup)
* **What it is:** Institutions quietly build their positions.
* **What it looks like:** Price often moves sideways in a range. Volatility is low.
* **The Goal:** To accumulate orders without alerting the rest of the market.
* **The Tool:** Highlights this phase in a **Blue Box**.
### 2. Manipulation (The Trap)
* **What it is:** A sudden, sharp move *against* the intended direction.
* **What it looks like:** Price breaks out of the accumulation range, often taking out previous highs or lows (Liquidity Sweeps).
* **The Goal:** To trigger stop-losses (creating liquidity) and trap breakout traders on the wrong side. This is often called the "Judas Swing."
* **The Tool:** Highlights this phase in a **Red Box**. It also marks the liquidity sweep with a specific line.
### 3. Distribution (The Move)
* **What it is:** The true trend unfolds.
* **What it looks like:** Price reverses from the manipulation and expands rapidly in the opposite direction.
* **The Goal:** To distribute the accumulated positions at a profit.
* **The Tool:** Highlights this phase in a **Green Box**.
* **Confirmation:** The transition from Manipulation to Distribution is confirmed by a **CISD (Change in State of Delivery)**—a break of structure that signals the trap is complete.
{% hint style="info" %}
By enabling the Early Models, you can visualize potential setups before price flips the weekly Open level. However, this option may generate premature or invalid signals, so it should be used cautiously and always combined with additional confluence.
{% endhint %}
### The Power of Context
By projecting this framework from a **Higher Timeframe (HTF)** onto your **Lower Timeframe (LTF)**, you can see the "story" of the candle as it forms. Instead of getting caught in the noise of a 1-minute chart, you see that the sudden drop might just be the "Manipulation" phase of the 4-hour candle, preparing for a massive rally.
---
# Agent Instructions
This documentation is published with GitBook. GitBook is the documentation platform designed so that both humans and AI agents can read, navigate, and reason over technical content effectively. Learn more at gitbook.com.
## Querying This Documentation
If you need additional information that is not directly available in this page, you can query the documentation dynamically by asking a question.
Perform an HTTP GET request on the current page URL with the `ask` query parameter, and the optional `goal` query parameter:
```
GET https://docs.candelacharts.com/models/amd-model/framework.md?ask=&goal=
```
`ask` is the immediate question: it should be specific, self-contained, and written in natural language.
`goal` is optional and describes the broader end goal you are ultimately trying to accomplish on behalf of the user. GitBook uses it to tailor the answer towards what is most useful for that goal.
The response will contain a direct answer to the question and relevant excerpts and sources from the documentation.
Use this mechanism when the answer is not explicitly present in the current page, you need clarification or additional context, or you want to retrieve related documentation sections.