> For the complete documentation index, see [llms.txt](https://docs.candelacharts.com/llms.txt). Markdown versions of documentation pages are available by appending `.md` to page URLs; this page is available as [Markdown](https://docs.candelacharts.com/oscillators/oscillator-concepts-tm/fractal-map.md).
# Fractal Map
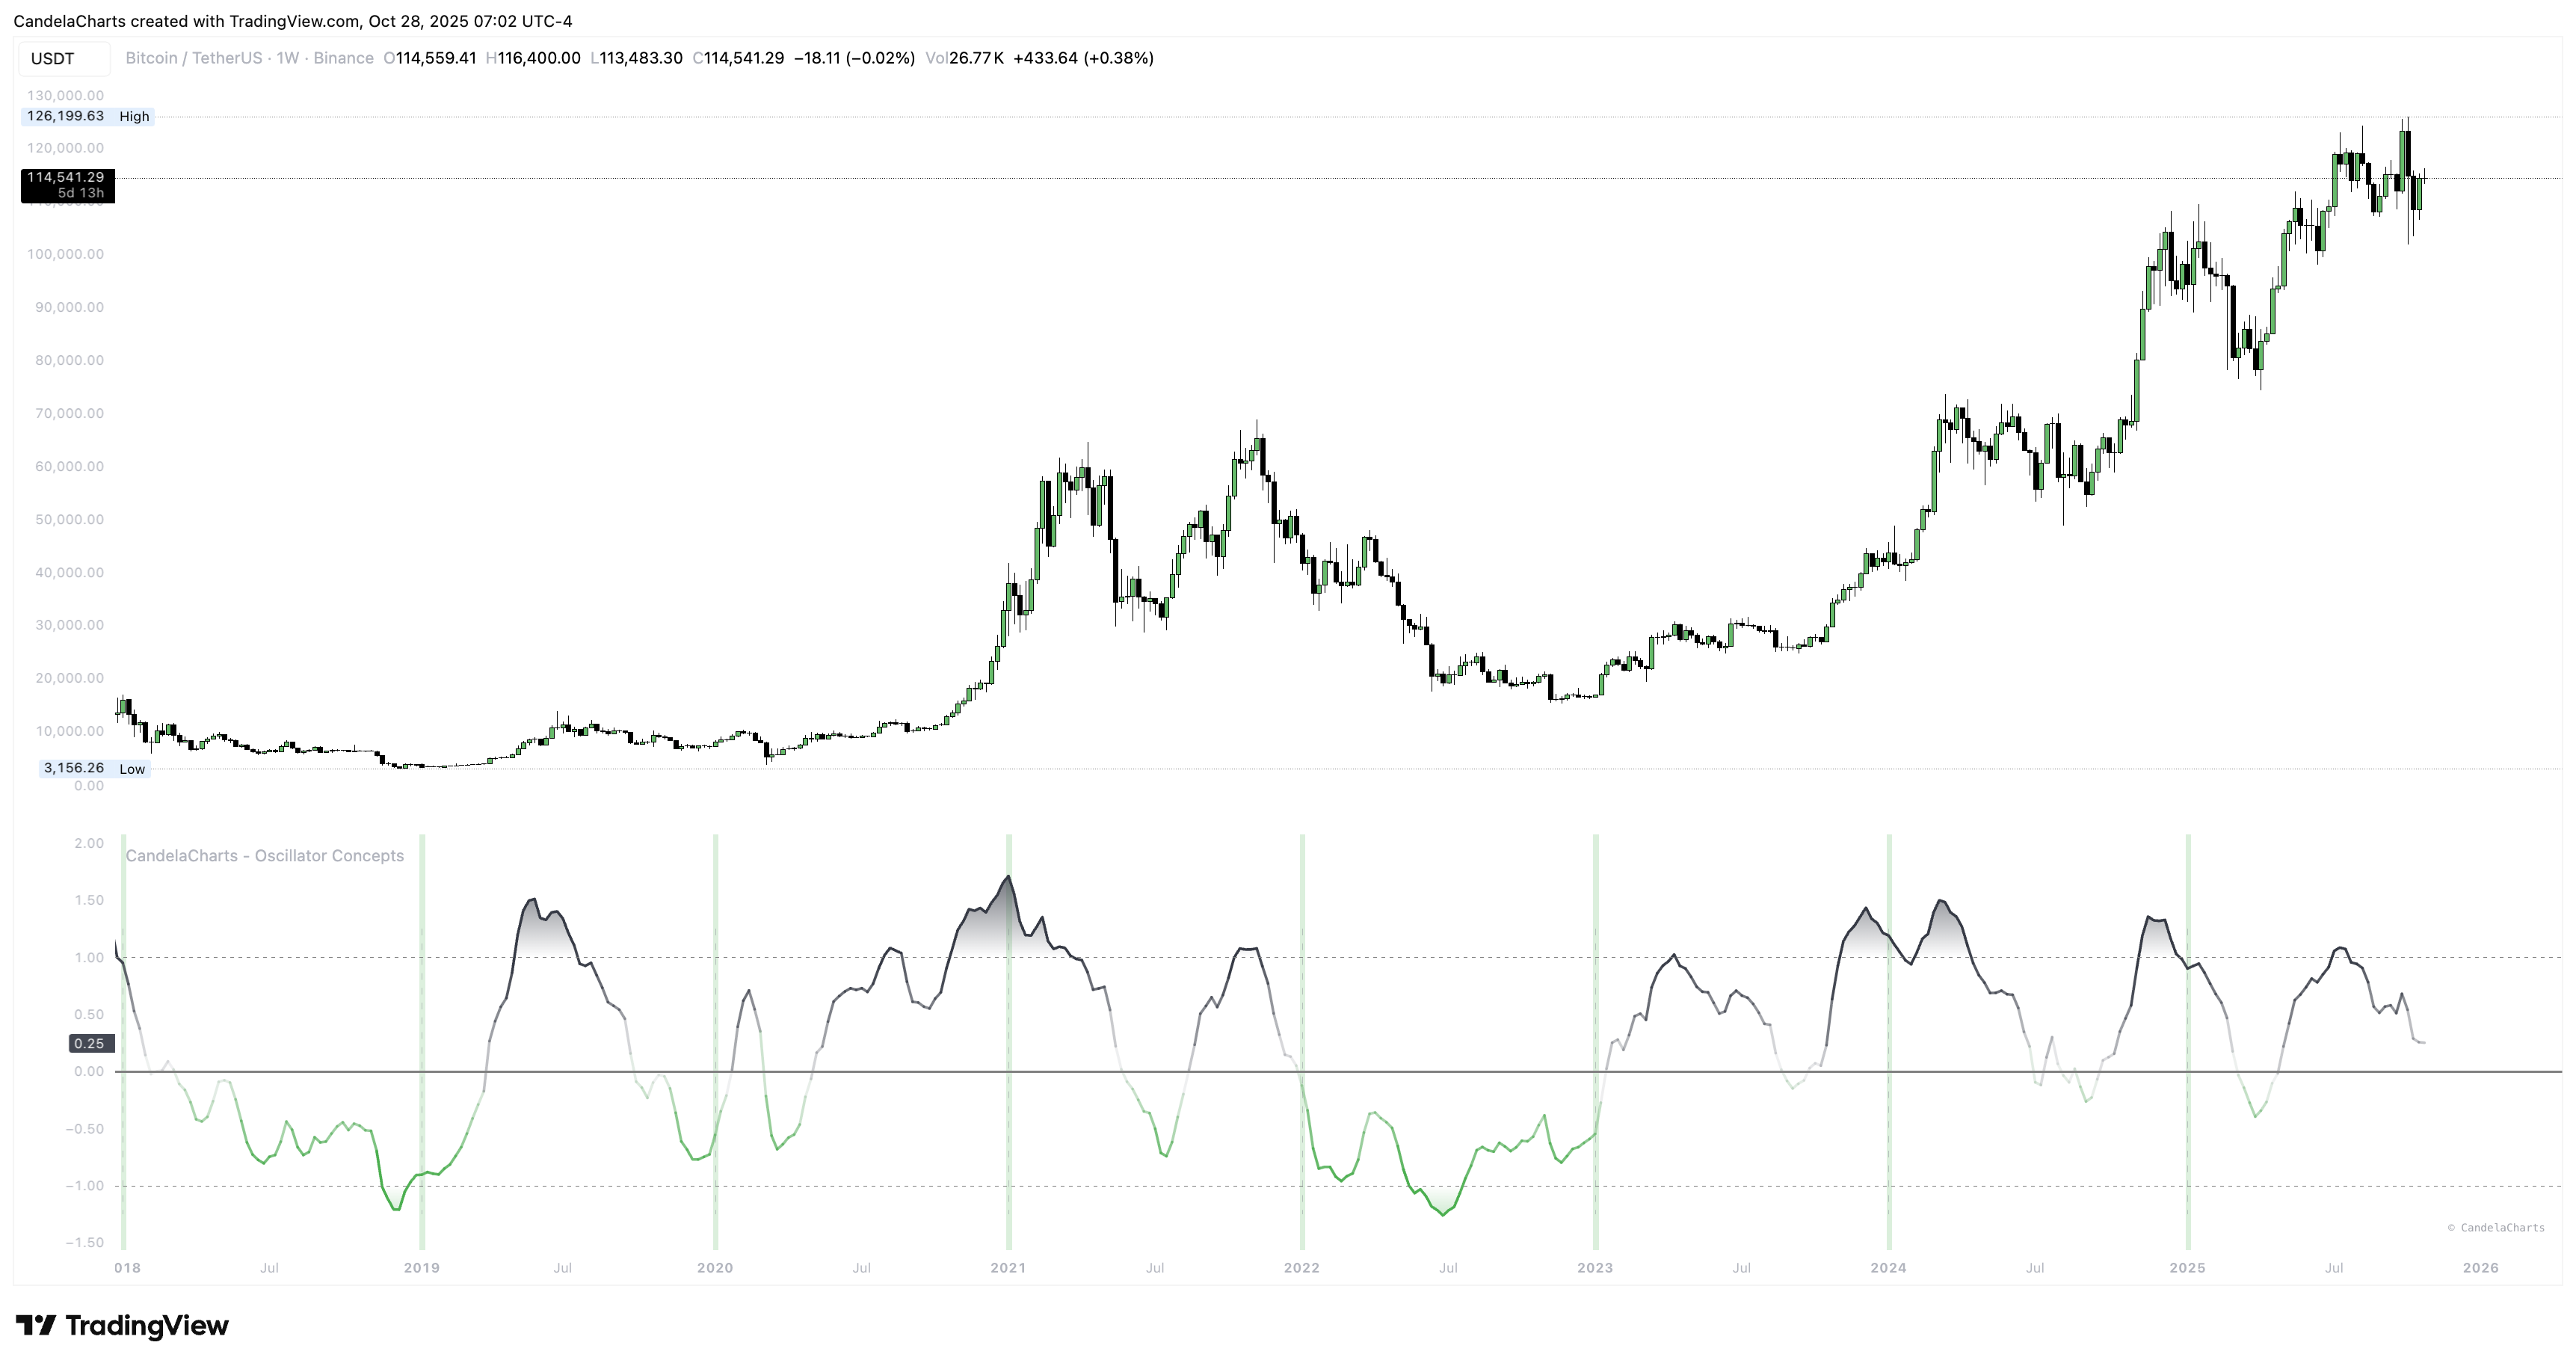
Sessions, weeks, and months create natural chapters. The Fractal Map draws light dividers at those boundaries so you always know where you are in the story and can plan around opens, closes, and transitions.
The tool picks sensible dividers for your chart’s timeframe so you don’t have to babysit settings. On higher timeframes it scales to larger segments to keep things clean.
* Treat fresh segments like a reset; they often bring new posture.
* Combine with the stripe: a new week that *starts* with a stripe flip often behaves differently from the prior week.
* During review, scan where divergences and re‑entries cluster relative to dividers—this reveals patterns in your market.
Keep the lines subtle for live trading. When studying history, temporarily increase contrast, then dial it back.
---
# Agent Instructions
This documentation is published with GitBook. GitBook is the documentation platform designed so that both humans and AI agents can read, navigate, and reason over technical content effectively. Learn more at gitbook.com.
## Querying This Documentation
If you need additional information that is not directly available in this page, you can query the documentation dynamically by asking a question.
Perform an HTTP GET request on the current page URL with the `ask` query parameter, and the optional `goal` query parameter:
```
GET https://docs.candelacharts.com/oscillators/oscillator-concepts-tm/fractal-map.md?ask=&goal=
```
`ask` is the immediate question: it should be specific, self-contained, and written in natural language.
`goal` is optional and describes the broader end goal you are ultimately trying to accomplish on behalf of the user. GitBook uses it to tailor the answer towards what is most useful for that goal.
The response will contain a direct answer to the question and relevant excerpts and sources from the documentation.
Use this mechanism when the answer is not explicitly present in the current page, you need clarification or additional context, or you want to retrieve related documentation sections.