> For the complete documentation index, see [llms.txt](https://docs.candelacharts.com/llms.txt). Markdown versions of documentation pages are available by appending `.md` to page URLs; this page is available as [Markdown](https://docs.candelacharts.com/oscillators/oscillator-concepts-tm/participation-analysis.md).
# Participation Analysis
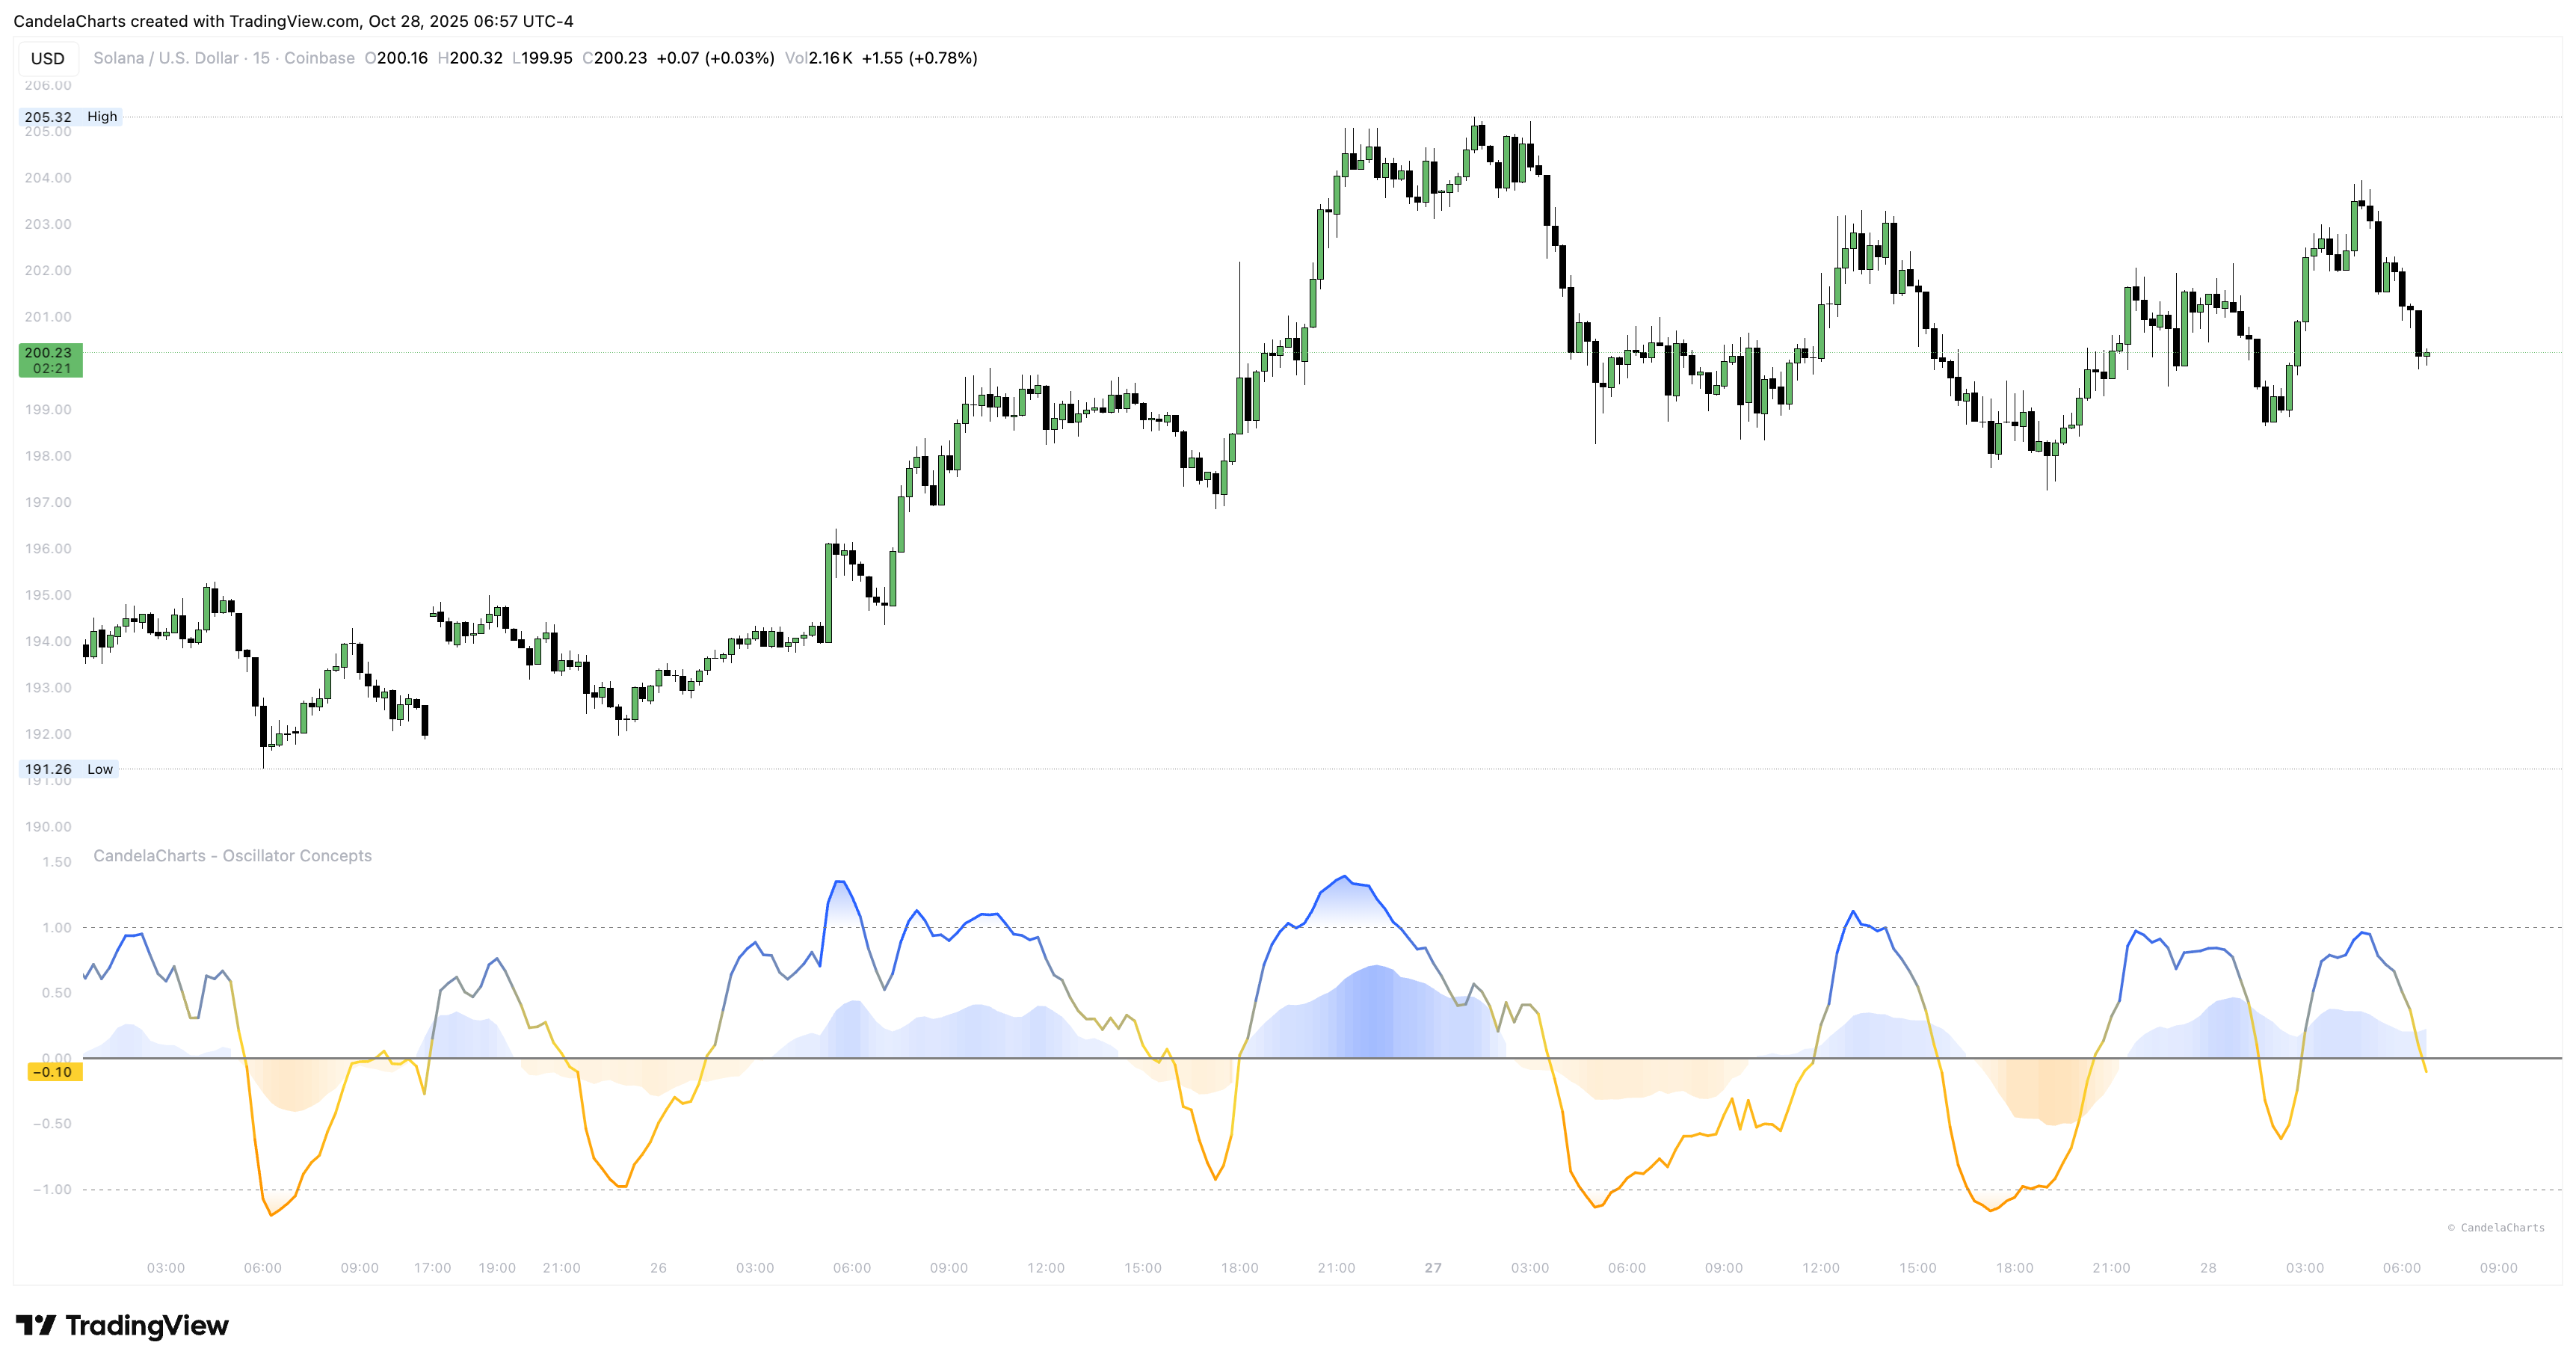
Participation shading reflects commitment. Green bias = buyers doing the work. Red bias = sellers in charge. It’s about *effort*, not just direction.
You can focus on one source of activity at a time—money flow behavior, directional volume, or change in volume—or let the tool balance several and surface agreement automatically. The combined view highlights alignment and softens disagreement so you don’t overreact to one noisy input.
### **How to read it**
* Rising line + clear green → constructive; continuation setups usually behave.
* Rising line + fading/ red → cautious; watch for stall, especially at structure or near the outer zone.
* Falling line + firm red → pressure; avoid counter‑trend longs unless the layer eases.
* Sudden color changes near calendar boundaries often precede behavior shifts—make note.
### **Practical use**
When you plan a breakout trade, glance at participation first. If it’s limp or fighting your idea, wait. When you plan a fade, *prefer* to see participation tiring into the stretch.
---
# Agent Instructions
This documentation is published with GitBook. GitBook is the documentation platform designed so that both humans and AI agents can read, navigate, and reason over technical content effectively. Learn more at gitbook.com.
## Querying This Documentation
If you need additional information that is not directly available in this page, you can query the documentation dynamically by asking a question.
Perform an HTTP GET request on the current page URL with the `ask` query parameter, and the optional `goal` query parameter:
```
GET https://docs.candelacharts.com/oscillators/oscillator-concepts-tm/participation-analysis.md?ask=&goal=
```
`ask` is the immediate question: it should be specific, self-contained, and written in natural language.
`goal` is optional and describes the broader end goal you are ultimately trying to accomplish on behalf of the user. GitBook uses it to tailor the answer towards what is most useful for that goal.
The response will contain a direct answer to the question and relevant excerpts and sources from the documentation.
Use this mechanism when the answer is not explicitly present in the current page, you need clarification or additional context, or you want to retrieve related documentation sections.