> For the complete documentation index, see [llms.txt](https://docs.candelacharts.com/llms.txt). Markdown versions of documentation pages are available by appending `.md` to page URLs; this page is available as [Markdown](https://docs.candelacharts.com/oscillators/oscillator-concepts-tm/the-line.md).
# The Line
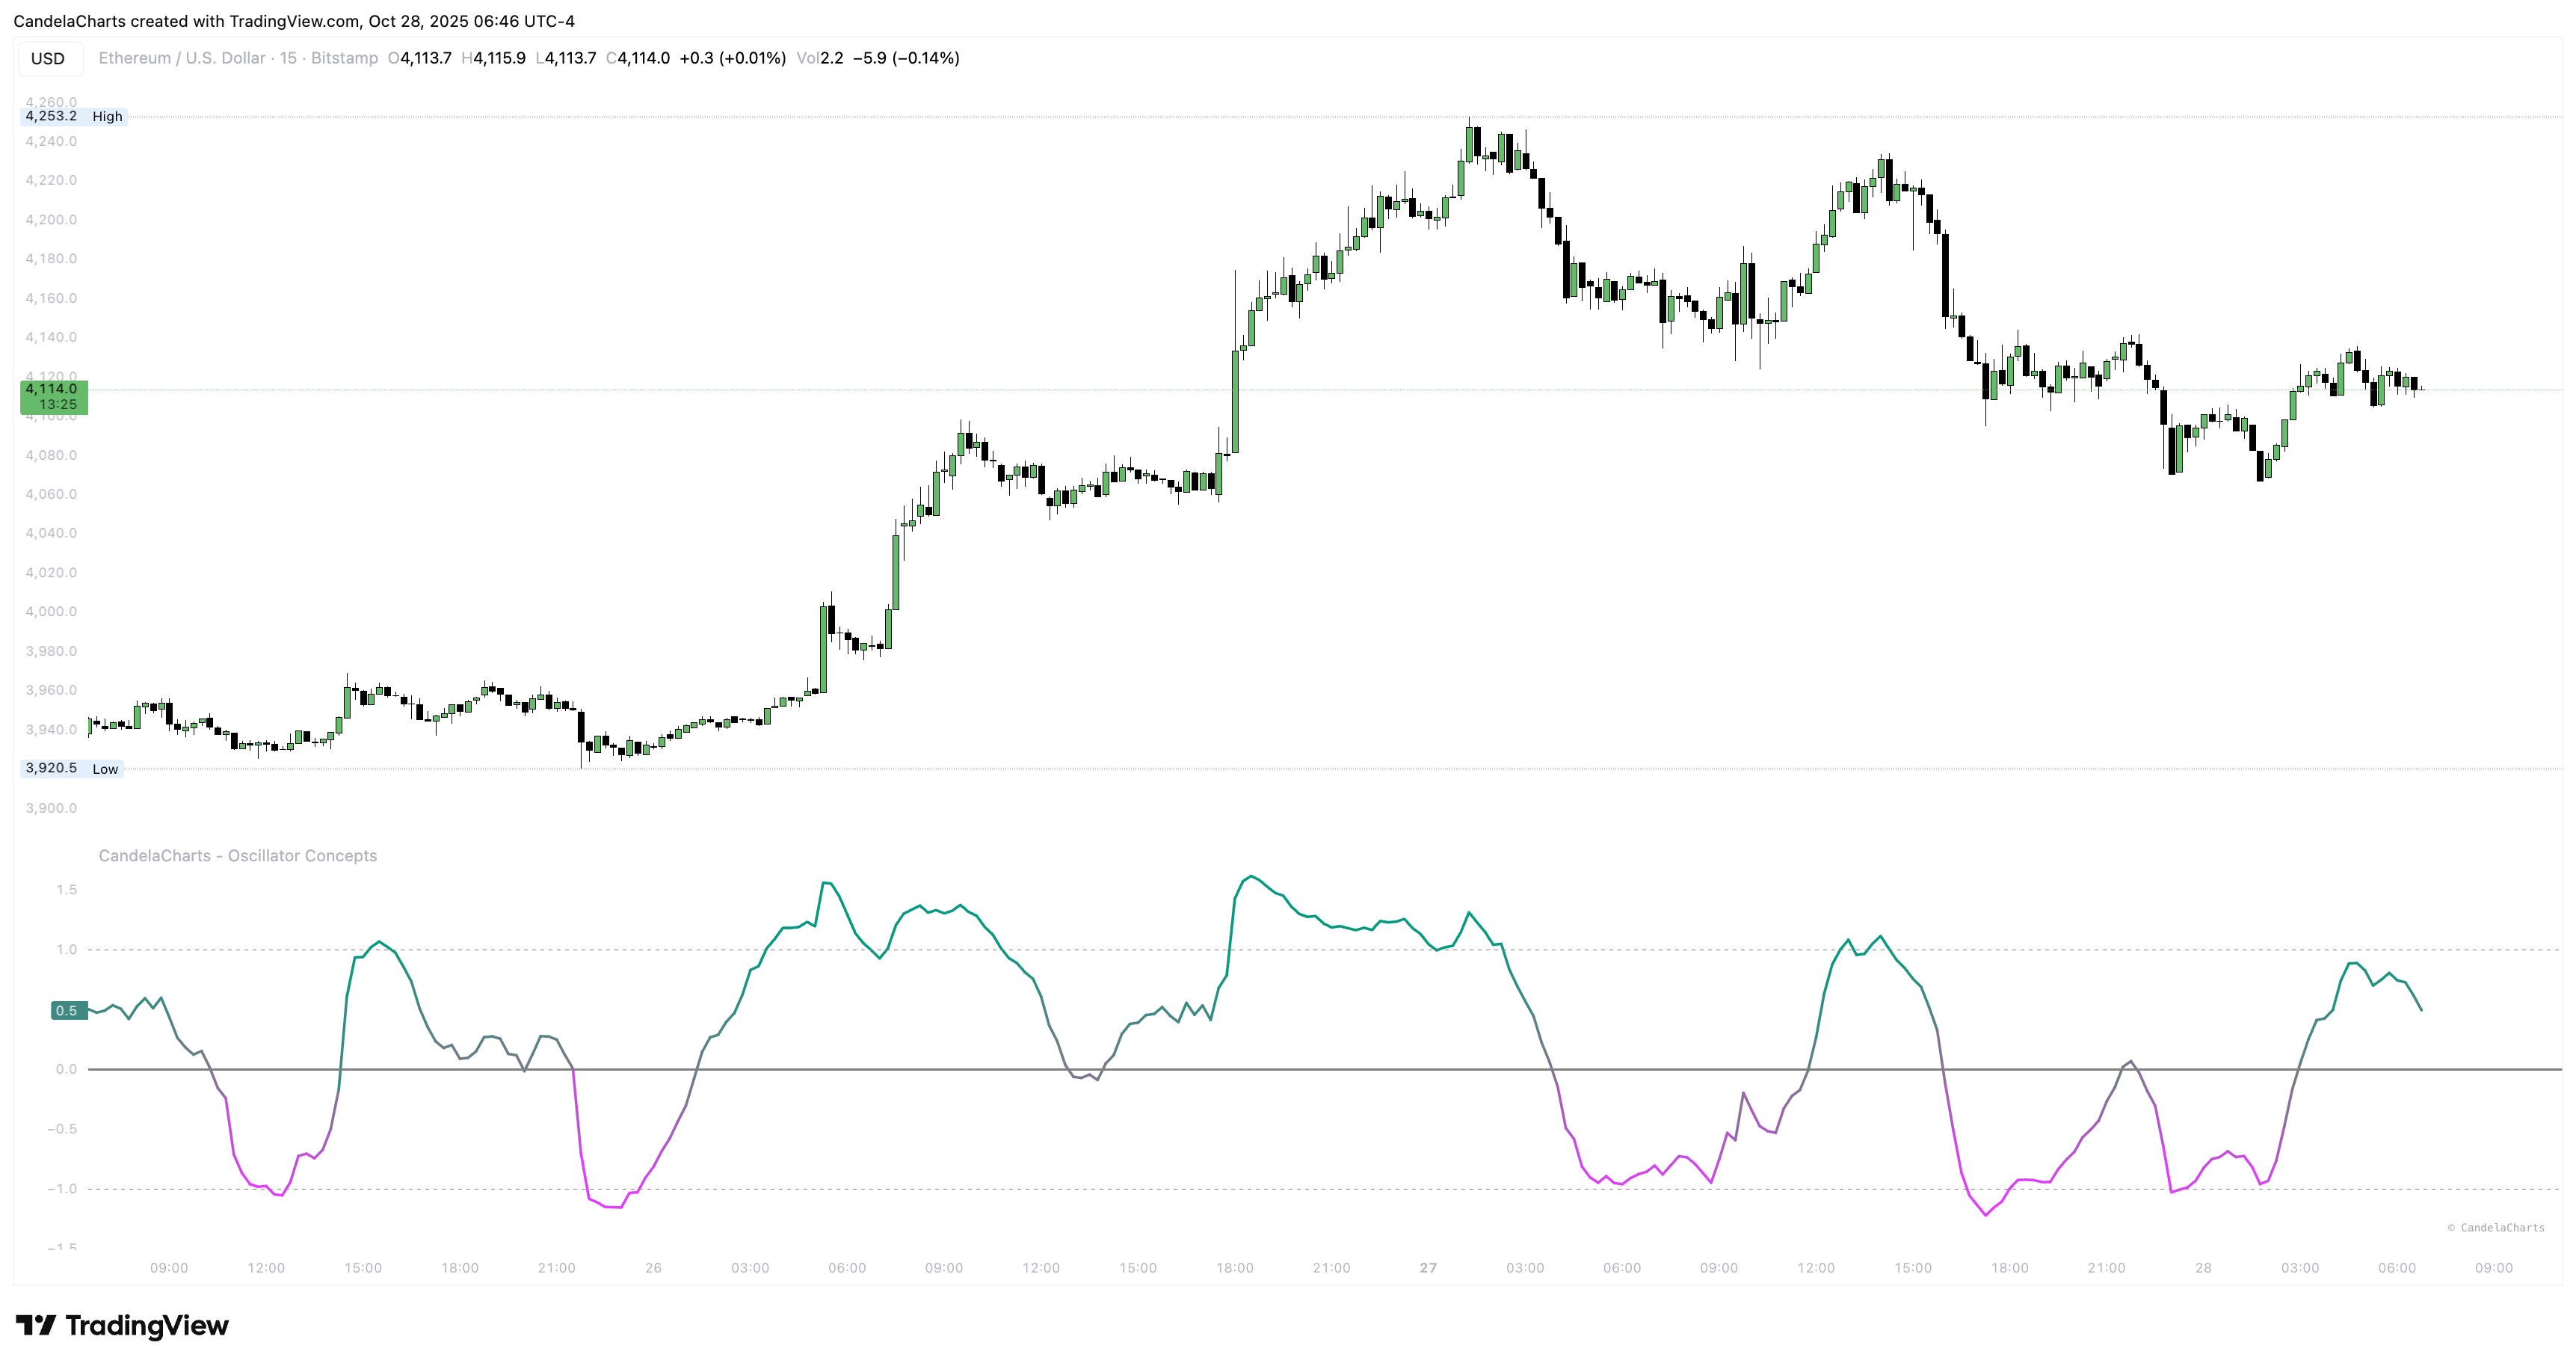
You’re looking at one clear line—**The Line**—that blends a handful of familiar momentum reads into a simple, readable curve. Think of the middle as *home base*. When it wanders far outside, the market is running hot. The quiet background layers (Participation, Trend Radar, Velocity Pulse, Fractal Map) are there to add flavor only when you need them—helpful context, not clutter.
Most days you’ll do three simple things:
* When the line sits near home base, take a breath and prepare. Let price build a story and glance at the layers for hints.
* When it pushes well outside, decide whether you’re **fading a stretch** or **riding pressure with the trend**. Make that call because the context agrees, not on a hunch.
* When it comes back toward the band after being stretched, treat that as a practical **timing cue**—especially if participation is tiring and the trend stripe is softening.
If anything ever feels too loud, hide that layer and keep trading. The indicator should feel like a friendly narrator: it highlights pressure, energy, and backdrop so you can handle entries, exits, and risk with a clear head.
---
# Agent Instructions
This documentation is published with GitBook. GitBook is the documentation platform designed so that both humans and AI agents can read, navigate, and reason over technical content effectively. Learn more at gitbook.com.
## Querying This Documentation
If you need additional information that is not directly available in this page, you can query the documentation dynamically by asking a question.
Perform an HTTP GET request on the current page URL with the `ask` query parameter, and the optional `goal` query parameter:
```
GET https://docs.candelacharts.com/oscillators/oscillator-concepts-tm/the-line.md?ask=&goal=
```
`ask` is the immediate question: it should be specific, self-contained, and written in natural language.
`goal` is optional and describes the broader end goal you are ultimately trying to accomplish on behalf of the user. GitBook uses it to tailor the answer towards what is most useful for that goal.
The response will contain a direct answer to the question and relevant excerpts and sources from the documentation.
Use this mechanism when the answer is not explicitly present in the current page, you need clarification or additional context, or you want to retrieve related documentation sections.